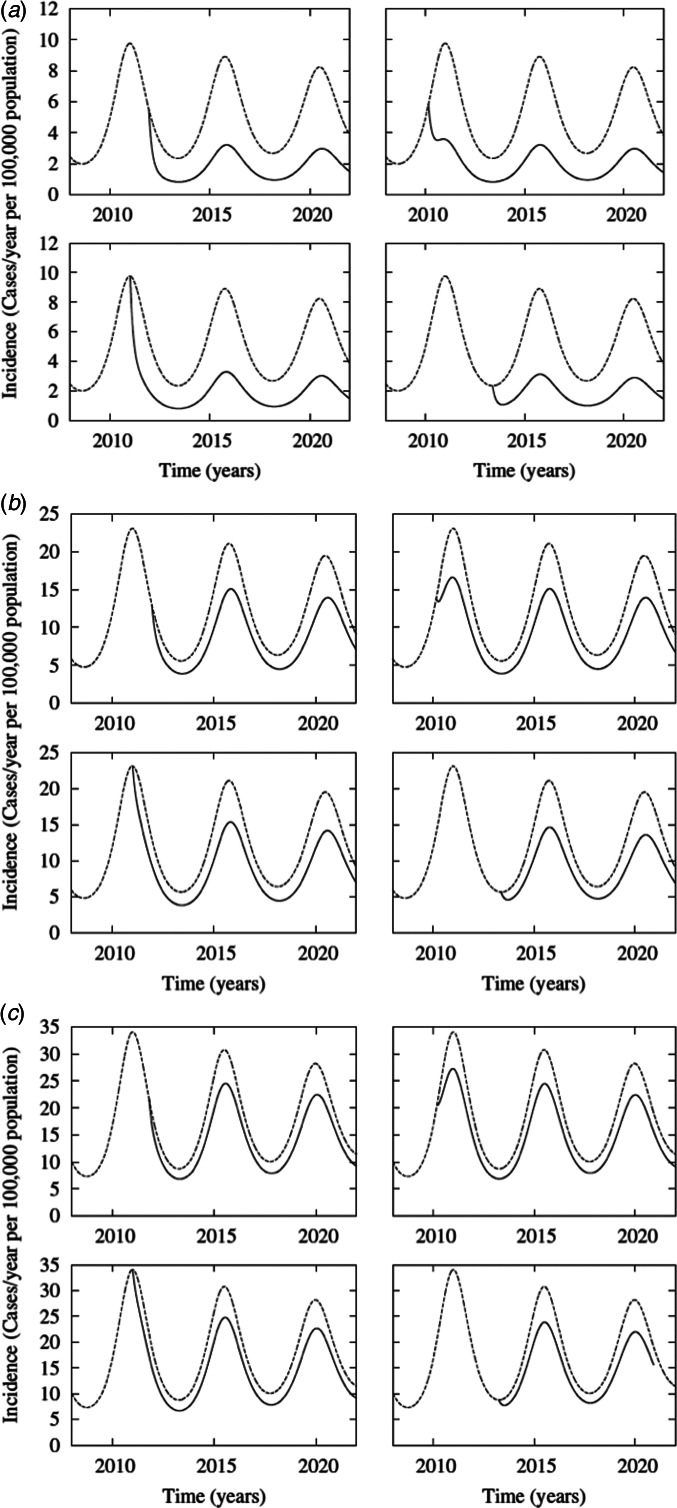
Fig. 4.
(A): Dynamic evolution of severe-pertussis incidence in the 0–2-month (m) age group predicted by the model after the introduction of the aP booster to pregnant women. Each panel plots the incidence pattern in cases per year per 100 000 on the ordinate for introduction of the booster at a different stages in the dynamic cycle (solid line) of the disease within the years from 2010 to 2020 indicated on the abscissa compared with the expected pattern in the absence of the booster (dashed line). The upper-left graph corresponds to the actual introduction of the booster (in 2012, after the 2011 incidence peak). The upper-right, lower-left and lower-right panels depict the hypothetical situations in which the booster was introduced before the first peak, exactly at the peak, or at the first minimum after the peak, respectively. The calculations were performed on the basis of a high DTP3-coverage scenario (95%). (B) The same as A but for the incidence in the 0–12-month age group. (C) The same as (B), but for a low DTP3-coverage scenario (80%).

