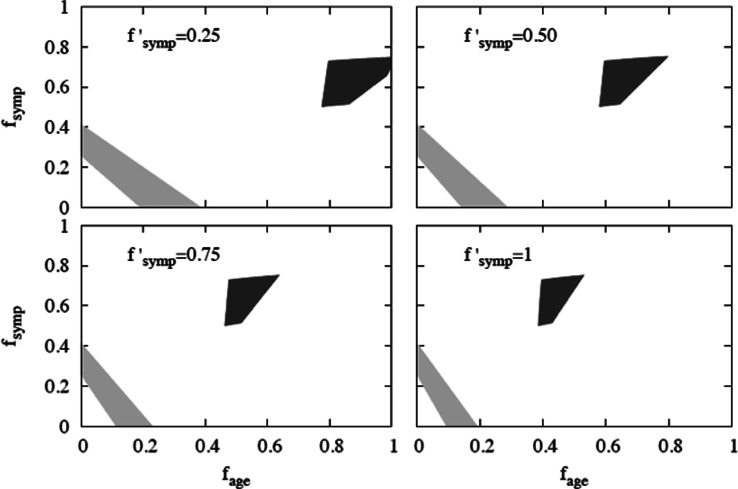
Fig. 5.
Evaluation of the compatibility of the results from the model with the reported epidemiological data. Each of the panels of the figure refers to a fixed value of f ′symp. The shaded areas correspond to the set of points (fage, fsymp) that verify that 0.55 < A < 0.65 (light grey) and to the set of points (fage, fsymp) that verify simultaneously 0.3 < B(2015) <0.4, 0.3 < B(2016) <0.4 and 0.8 < B(2016)/B(2015) <0.9 (dark grey). A and B as functions of fage, fsymp and f ′symp are derived from equations (1) and (2) containing the results obtained with the model. The inequalities imposed on the functions A and B, which ranges generate the respective light- and dark-grey-shaded areas, arise from the epidemiological observations and the range of variation assigned to them (see text). In each of the graphs, the parameter fsymp is plotted on the ordinate as a function of fage on the abscissa.

