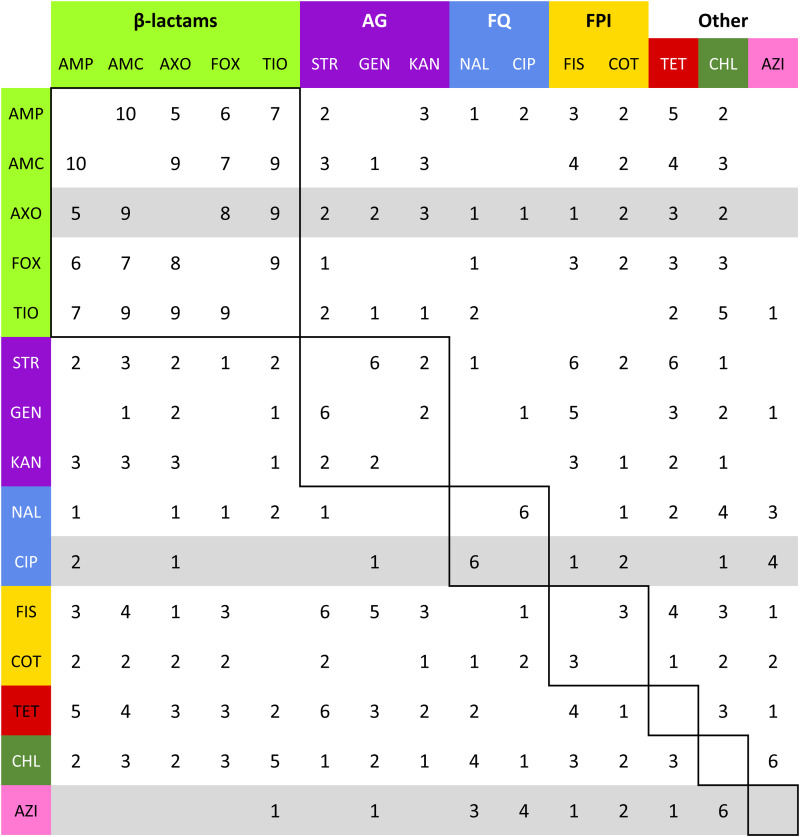
Fig. 4.
Summation of adjacency matrices of Rs. Elements of the matrix represent the frequency of the edges corresponding to row and column. Row and column labels are coloured to correspond to the class of the respective drug resistance (see Table 2). Elements enclosed by solid lines in the matrix represent edges that join resistances to drugs of the same class (matched-class edges) and other elements represent edges between resistances to drugs of different classes (cross-class edges). Rows representing resistances to drugs used to treat NTS are highlighted in grey.

