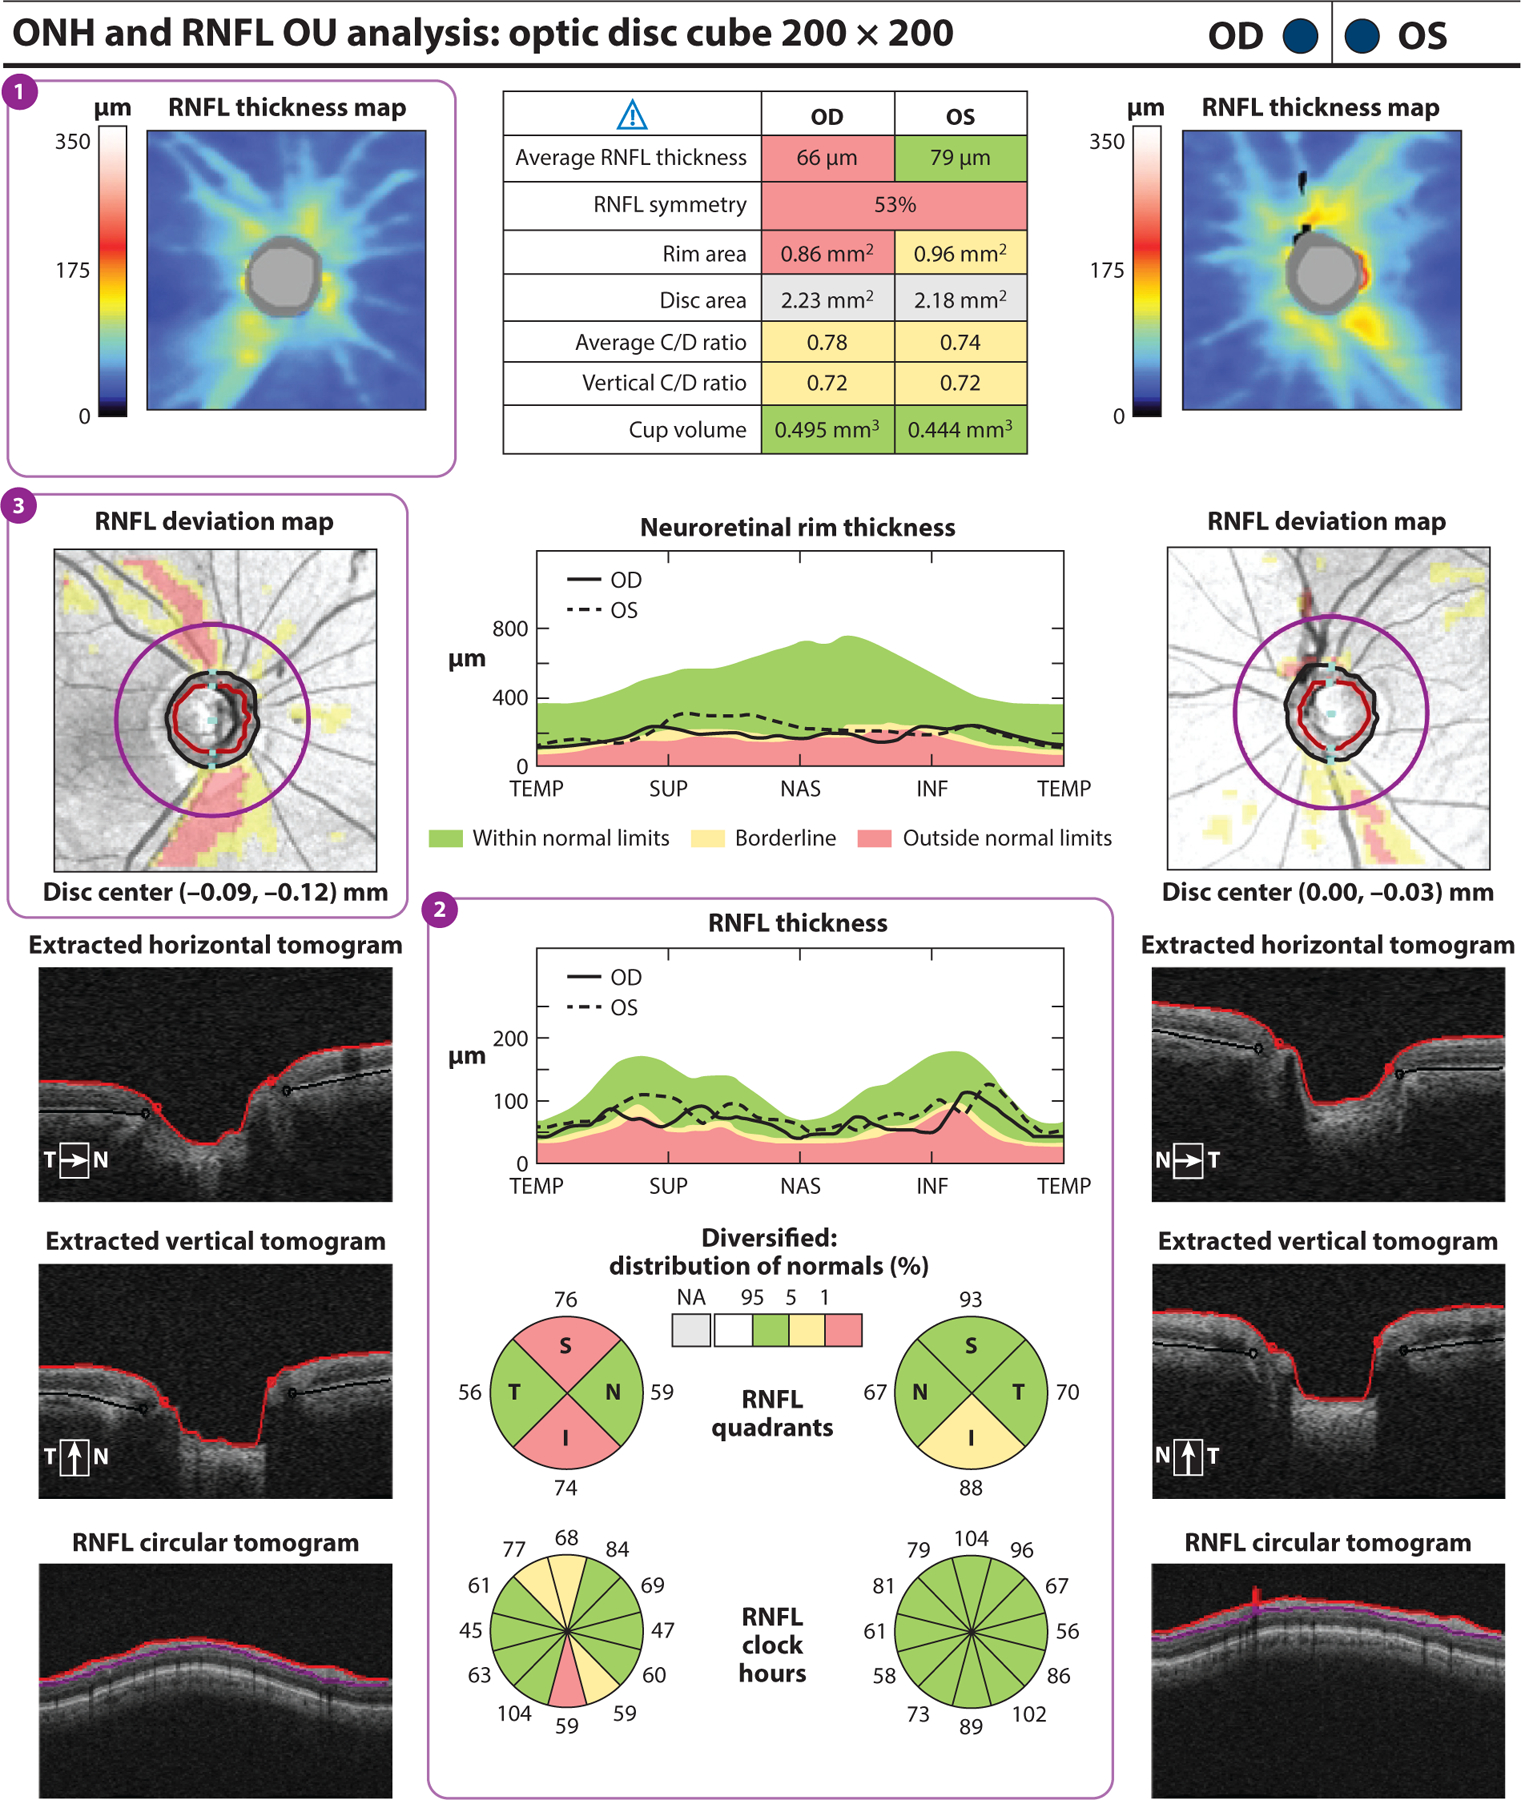
Figure 2.

Cirrus HD-OCT (Carl Zeiss Meditec, Dublin, California) report for a subject with one glaucomatous eye (OD) and one nonglaucomatous eye (OS). (a) The RNFL thickness map (①) displays RNFL thickness around the optic disc through a color map, with the thicker RNFL measurements in red and yellow and the thinner RNFL measurements in green and blue. RNFL thickness measurements by quadrant (S, I, N, and T) and clock hour are shown. (②) Values within the normal range of age-matched controls are in green (within normal limits). Values that fall outside the normal range for their age are displayed in yellow if p < 5% and ≥ 1% (borderline) or in red if p < 1% (outside normal limits). RNFL thickness in the superior and inferior quadrants is abnormal in OD compared with OS, in which the inferior quadrant is borderline. The RNFL deviation map (③) shows RNFL thickness deviations from the normative database overlaid on an en face image. Borderline RNFL thickness measurements are shown in yellow, and RNFL thicknesses outside normal limits are shown in red. Substantial glaucomatous thinning is seen in red OD. Abbreviations: C/D ratio, cup-to-disc ratio; HD-OCT, high-definition optical coherence tomography; I, inferior; N, nasal; NA, not applicable; ONH, optic nerve head; RNFL, retinal nerve fiber layer; S, superior; T, temporal.
