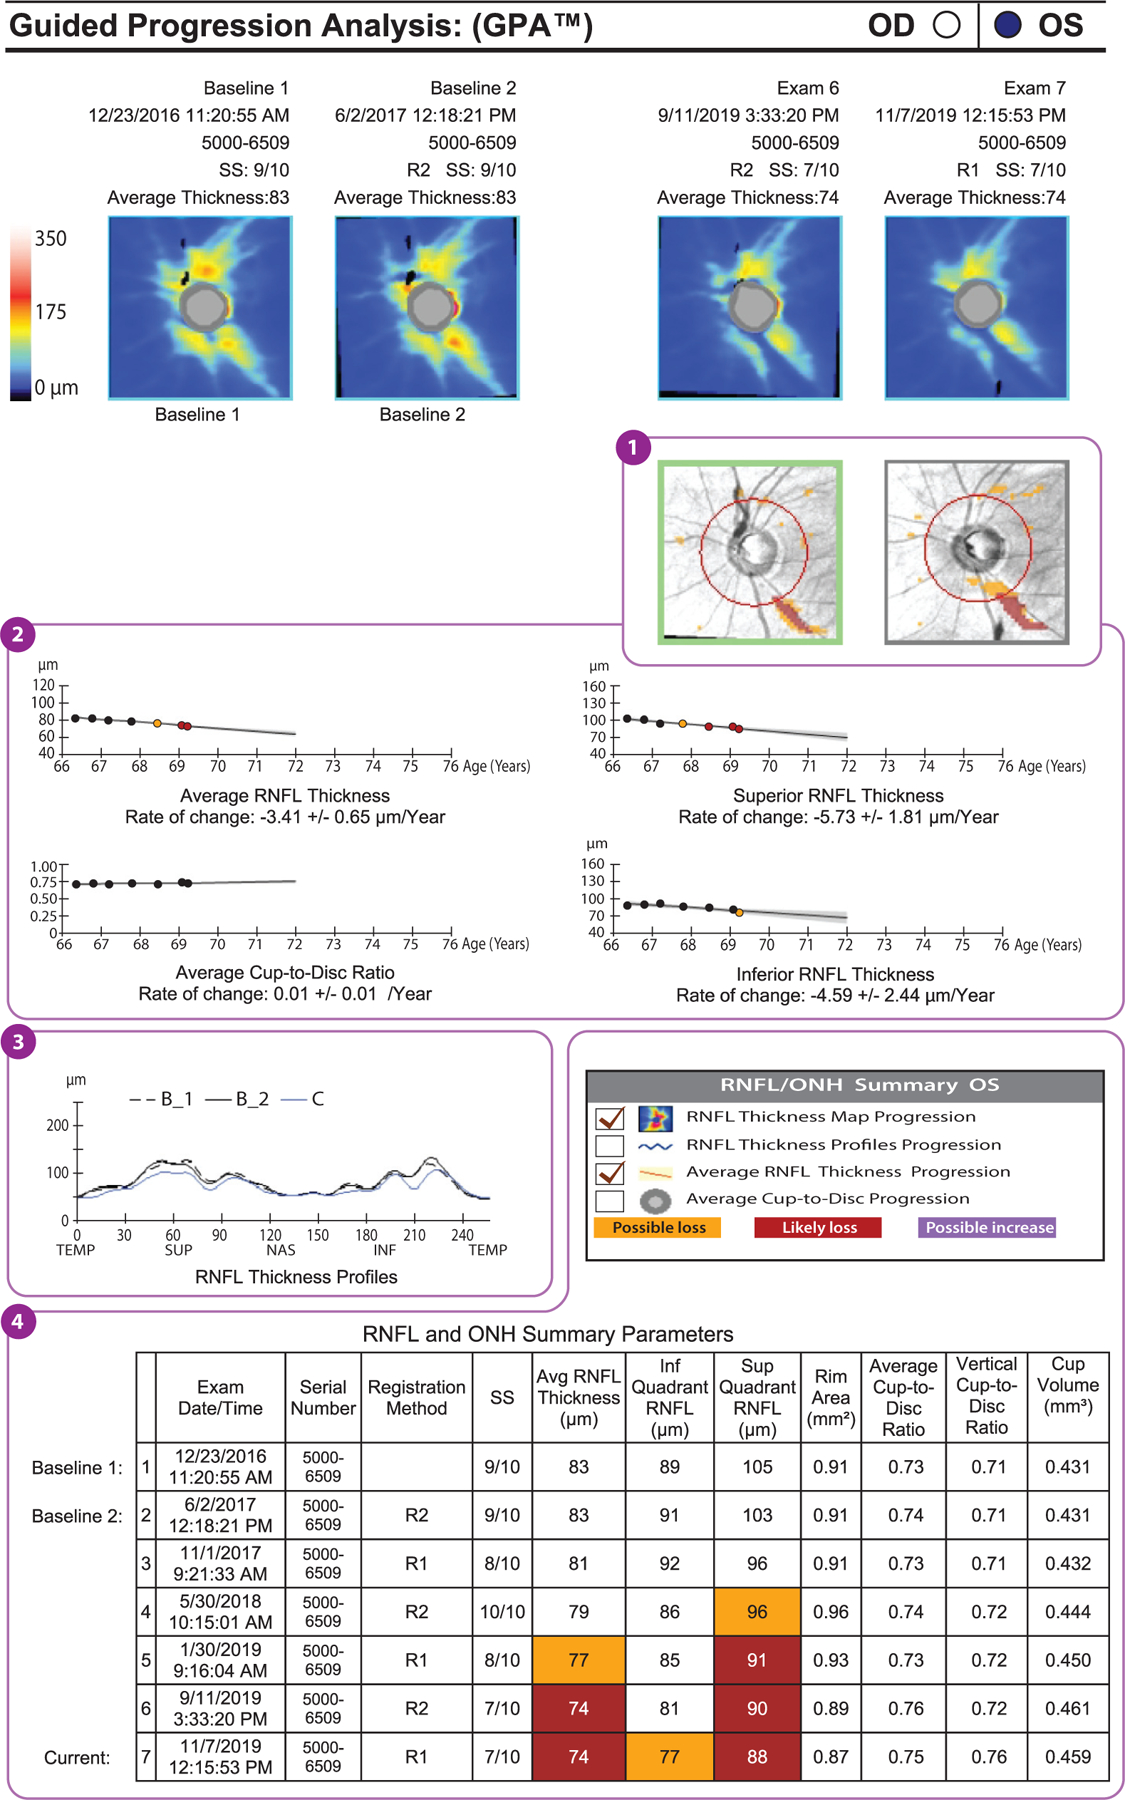
Figure 3.

Example of a GPA report (Carl Zeiss Meditec, Dublin, California) of a glaucomatous eye that has shown progression in peripapillary RNFL thickness (format modified for publication). The deviation map (①) shows areas of change that are statistically significant for the first time (orange) and subsequent areas of statistically significant change (red). The location and shape of these areas of change indicate the likelihood that the RNFL thinning actually represents glaucoma and its progression. In other words, if the location and shape are consistent with glaucoma, then it is likely that the detected changes are due to glaucoma. Below the deviation maps, graphs show the average RNFL, the superior RNFL, and the inferior RNFL thicknesses over time (②). Again, the first statistically significant drop in RNFL thickness is indicated by an orange dot, and subsequent significant reductions are indicated by red dots. These are trend analyses, as opposed to the event analyses shown in the deviation maps. The average cup-to-disc ratio graph indicates whether there is a statistically significant increase in cup-to-disc ratio. If the RNFL is decreasing and the cup-to-disc ratio is increasing, then this is good corroboratory evidence that the change measured is real. Below these graphs is the RNFL thickness profile (③), on which the baseline profiles (B_1 and B_2) are overlaid on today’s visit (C). This is a useful graph in that the locations and degrees of thinning can be seen, and if they are in areas that would be expected to change with glaucoma, then this increases the likelihood that those changes are real glaucomatous changes. The table of RNFL and ONH summary parameters (④) presents the same data shown in panel a and highlights statistically significant change in orange and red. Abbreviations: GPA, guided progression analysis; INF, inferior; NAS, nasal; ONH, optic nerve head; RNFL, retinal nerve fiber layer; SS, signal strength; SUP, superior; TEMP, temporal.
