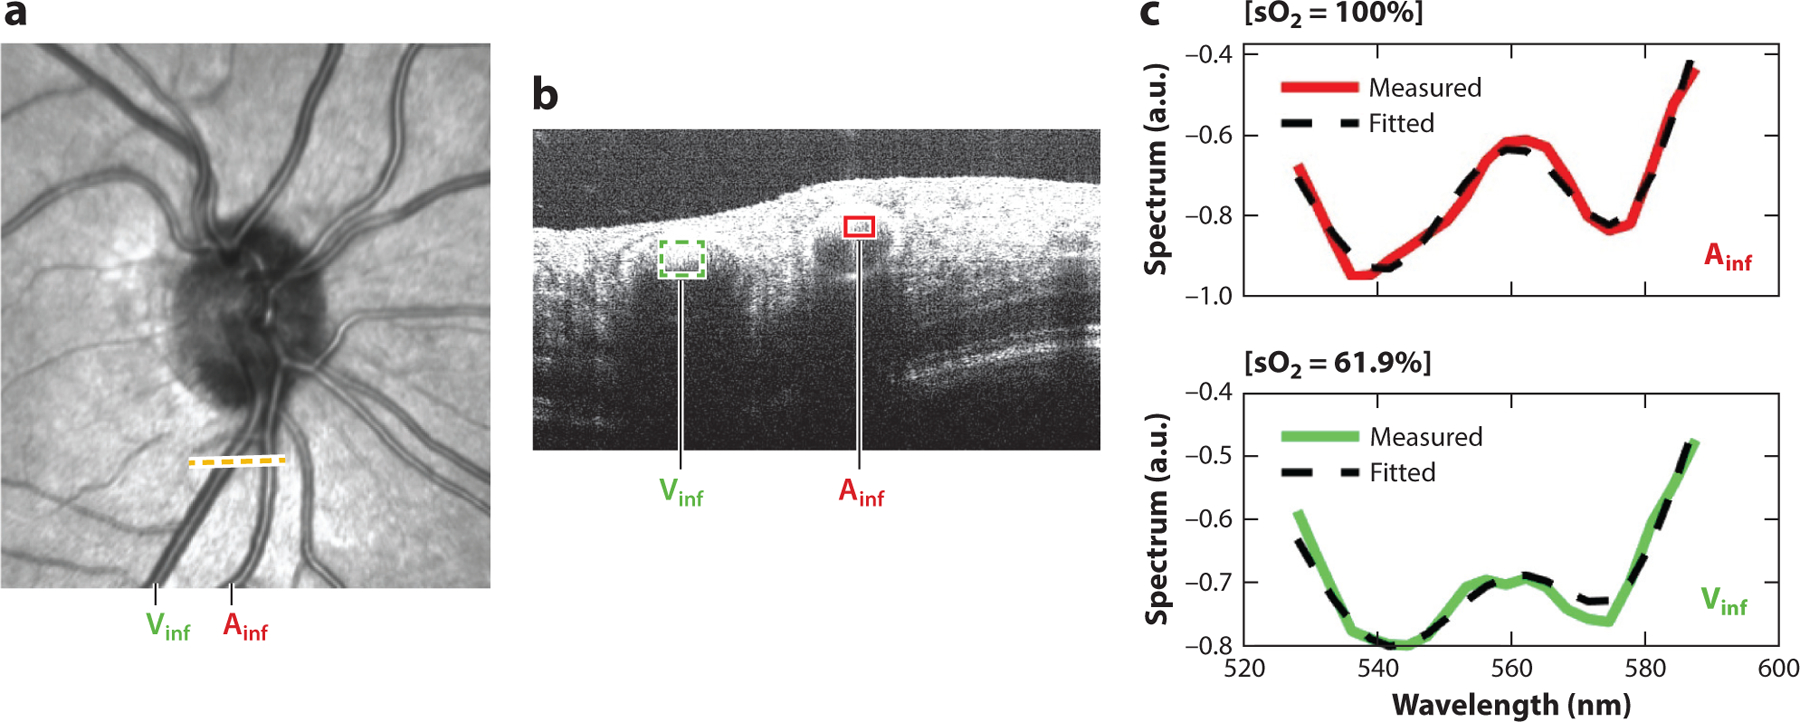
Figure 6.

The artery (Ainf) and vein (Vinf) at the dotted line on the (a) en face visible-light OCT image are seen in the (b) B-scan, from which (c) their respective spectroscopic OCT signals are fitted to the hemoglobin absorption profile to determine retinal arterial and venous blood oxygen saturations. Image courtesy of Z. Ghassabi, M. Wu, I. Rubinoff, Y. Wang, B. Davis, B. Tayebi, G. Wollstein, J. Schuman, H. Zhang & H. Ishikawa (unpublished study). Abbreviation: OCT, optical coherence tomography.
