Figure 1.
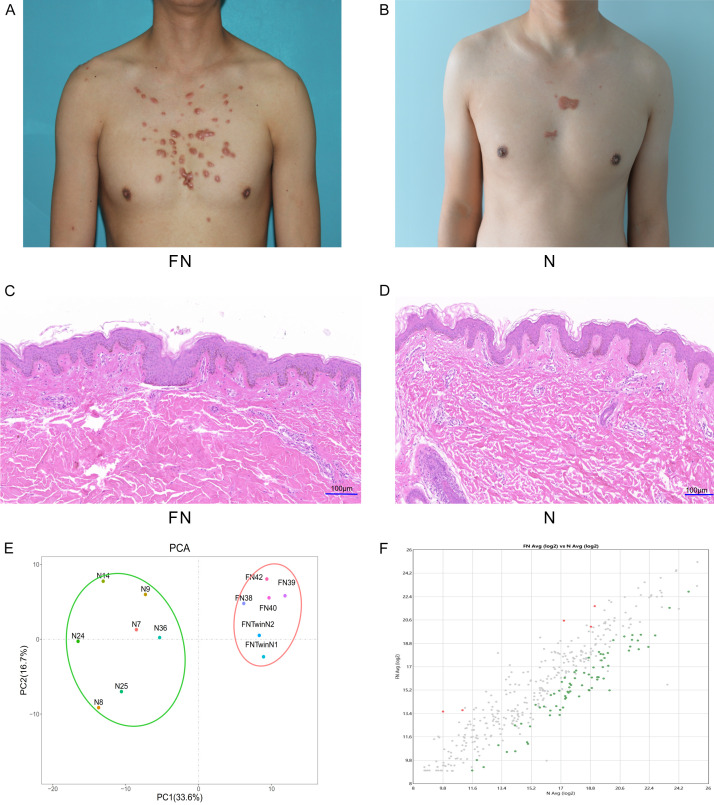
A. Photograph of the chest of a keloid patient with a family history of keloids (FN group). B. Photograph of the chest of a patient with sporadic keloids (N group). C. HE staining of the FN group, × 100. D. HE staining of the N group, × 100. E. Principal component analysis (PCA) of samples between the FN and N groups. In the figure, principal component 1 (PC1) and principal component 2 (PC2) are used as the X-axis and Y-axis, respectively, to draw the scatter diagram, where each point represents a sample. In such a PCA diagram, the farther the two samples are from each other, the greater the difference is between the two samples in terms of gene expression patterns. F. A scatter plot between the FN and N groups. The horizontal and vertical coordinates represent the average value of each gene that is differentially expressed between the FN and N groups. The cutoffs of log2 fold change > 1.5 or < -1.5 and P < 0.05 were used as the screening criteria. Significantly upregulated DEGs are shown in red, and significantly downregulated DEGs are shown in green.

