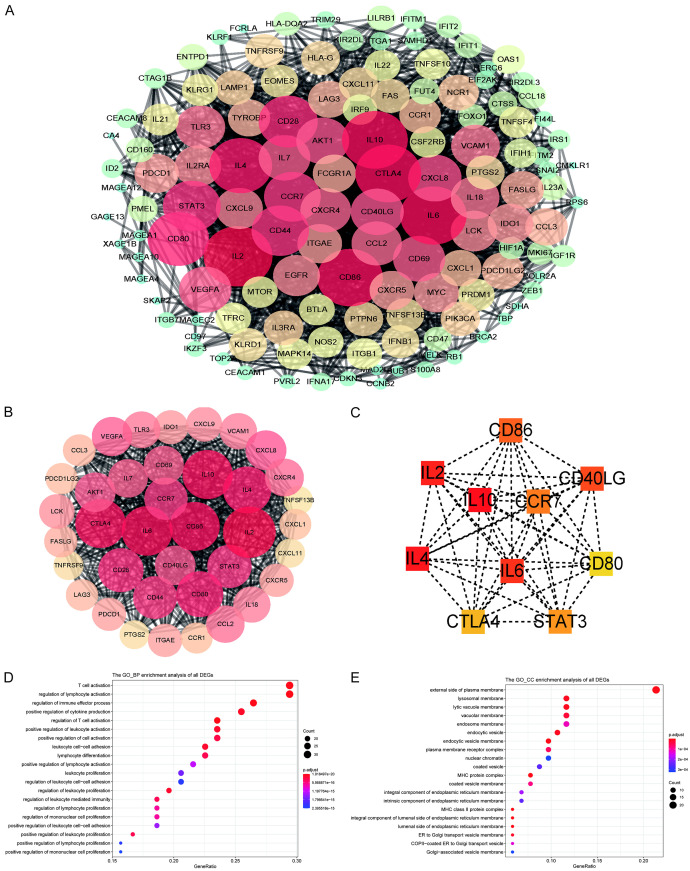
Figure 2.
A. The PPI network of DEGs in the FN and N groups. B. MCODE was performed for the FN and N groups. Protein complexes are represented as graphs, using the spoke model. The vertices represent proteins, and the edges represent experimentally determined interactions. The criteria for MCODE were: MCODE score > 5, degree cutoff = 2, k-score = 2, maximum depth = 100, and node score cutoff = 0.2. When the degree ≥ 10, hub genes were identified. C. The hub genes were identified from the PPI network in the FN and N groups. D, E. GO enrichment analyses of biological processes (BP) and cellular components (CC) between the FN and N groups.

