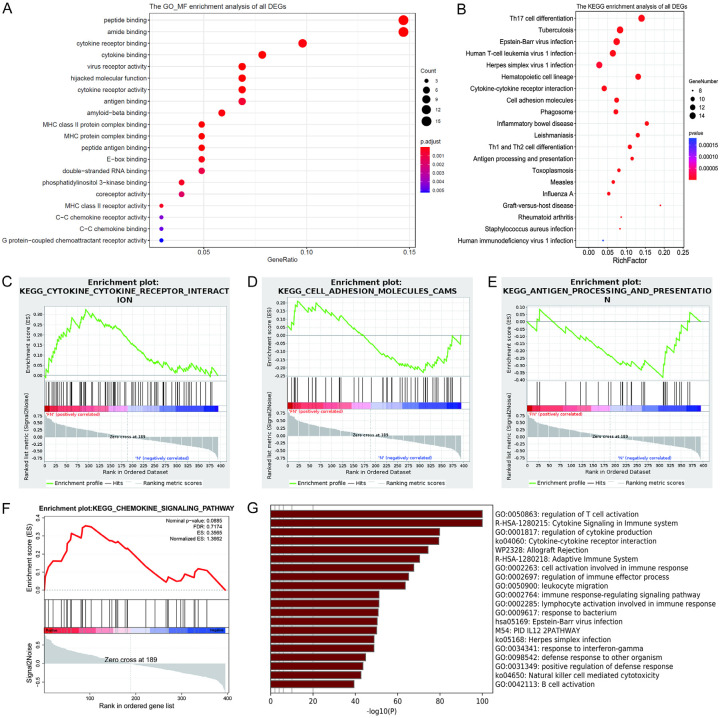
Figure 3.
A. GO enrichment analyses of molecular functions (MF) of DEGs between the FN and N groups. B. KEGG pathway analysis of DEGs between the FN and N groups. The cutoffs for log2 fold change > 1.5 or < -0.5 and P < 0.05 were used as the screening criteria. C-F. Gene set enrichment analysis (GSEA) was used to analyze the KEGG pathway obtained from the DEGs enrichment between the FN and N groups. G. Enrichment analysis for GO using Metascape.

