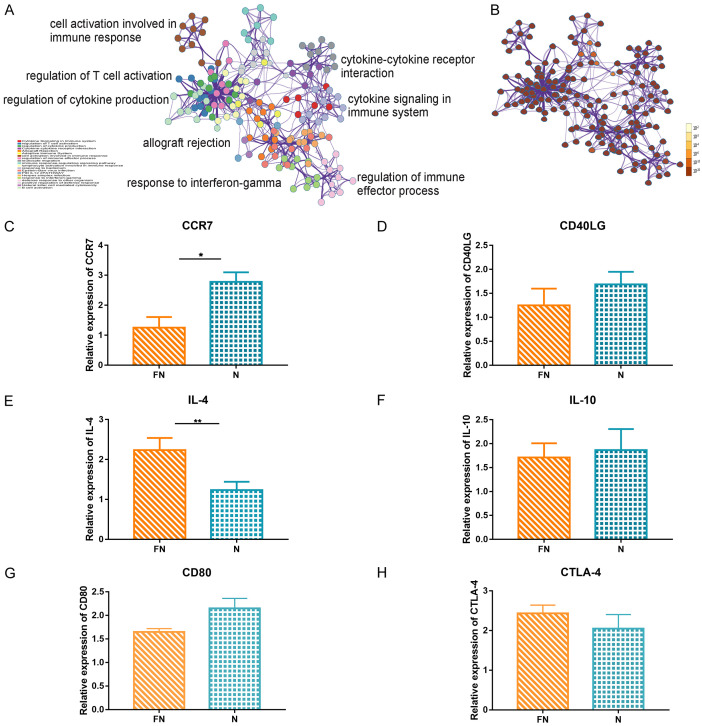
Figure 4.
A. The network of enriched terms colored by cluster ID, where nodes that share the same cluster ID are typically close to each other. B. The network of enriched terms colored by P-values, where terms containing more genes tend to have a more significant P-value. C-H. Relative expression of CCR7, CD40LG, IL-4, IL-10, CD80, and CTLA-4 by RT-qPCR analysis.

