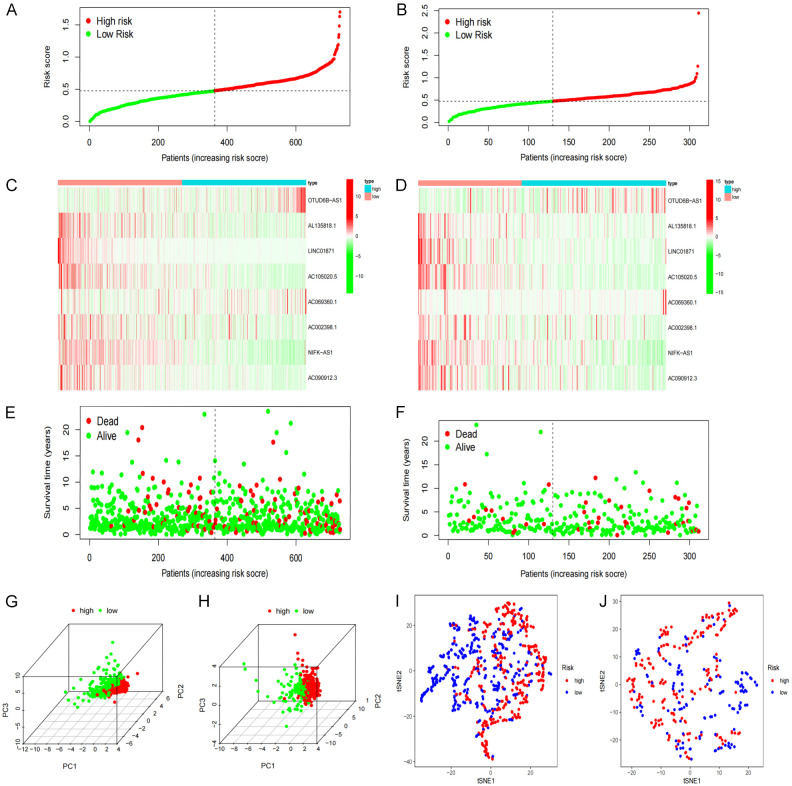
Figure 6.
Re-verification of the prognostic model. (A, B) The distribution and median of the risk score. (C, D) The status of OS and the distribution of risk scores. (E, F) Expression spectrum of pyroptosis-related lncRNA genes in training (E) and testing cohort (F). (G, H) PCA diagram. (I, J) t-SNE analysis.

