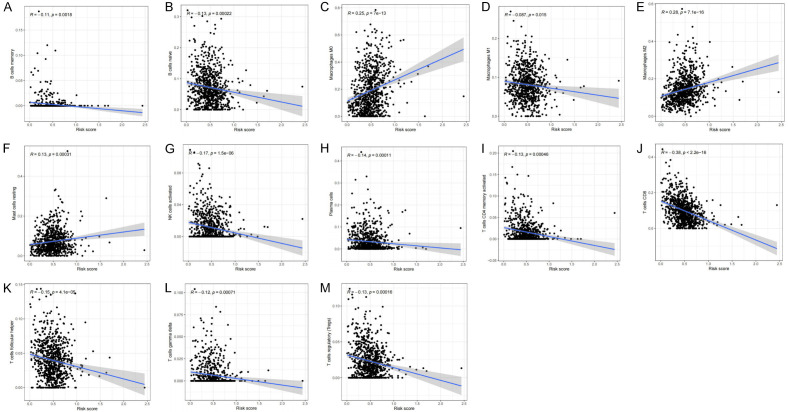
Figure 13.
Relationships between the risk score and infiltration abundances of 13 immune cell types. (A) B cells memory (P=0.0018), (B) B cells naive (P=0.00022), (C) Macrophages M0 (P=7e-13), (D) Macrophages M1 (P=0.015), (E) Macrophages M2 (P=7e-16), (F) Mast cells resting (P=0.00031), (G) NK cells activated (P=1.5e-06), (H) Plasma cells (P=0.00011), (I) T cells CD4 memory activated (P=0.00046), (J) T cells CD8 (P<2.2e-16), (K) T cells follicular helper (P=4.1e-05), (L) T cells gamma delta (P=0.0071), (M) T cells regulatory (Tregs) (P=0.00016).

