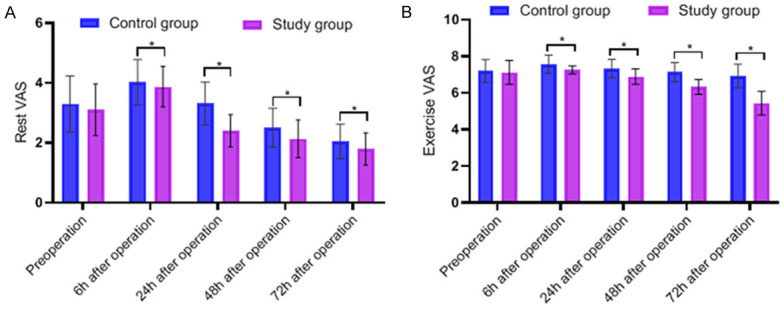
Figure 2.

Comparison of VAS scores. The differences in resting and exercise VAS scores between the two groups were not significant (P > 0.05). Repeated measure ANOVA: F value of time (Ft )=36.286 (P < 0.001), F value of group (Fg )=18.326 (P < 0.001), F value of interaction effect (Fi )=1.607 (P=0.184); pairwise comparison: the VAS scores of the study group at 6 h, 24 h, 48 h, and 72 h after surgery were significantly lower than those of the control group (P < 0.05).
