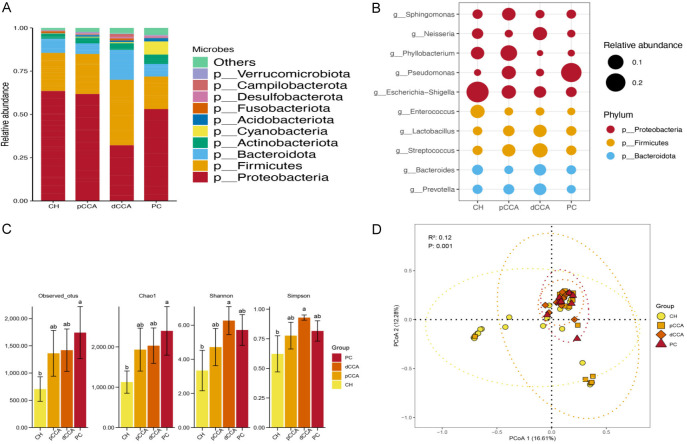
Figure 1.
The relative abundance of microbiota in all groups. A. The abundances of phyla in the CH, pCCA, dCCA, and PC groups. B. The abundances of genera in the CH, pCCA, dCCA, and PC groups. C. The α diversity indices of the CH, pCCA, dCCA, and PC groups. D. The β diversity indices of the CH, pCCA, dCCA, and PC groups.

