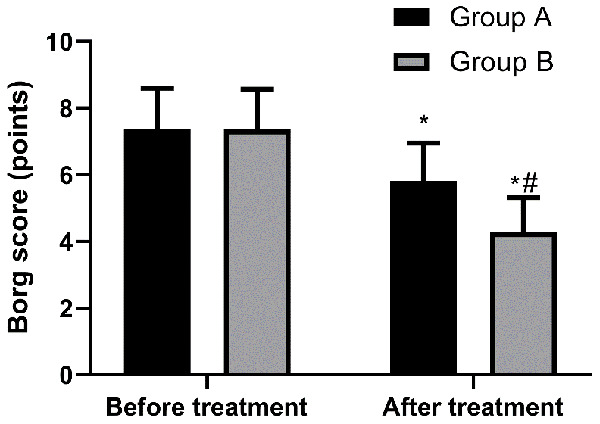
Figure 4.

Comparison of Borg score of the two groups before and after treatment. Before treatment, there was no difference in Borg score between the two groups (P > 0.05), while after treatment, Borg score of Group B was lower than that of Group A (P < 0.05). Note: * indicates that in comparison with the same group before treatment, P < 0.05. # indicates that in comparison with Group A, P < 0.05.
