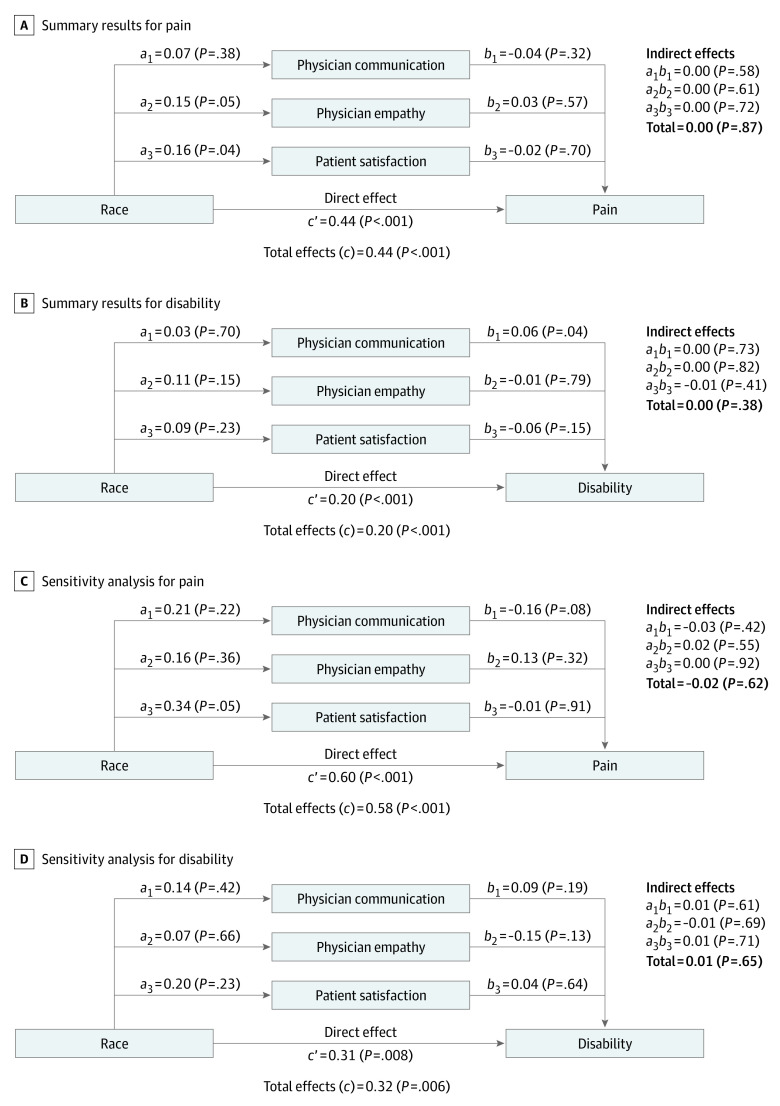
Figure 4. Summary of Mediation Analysis Results.
a, b, and ab indicate standardized coefficients in the regression model analyses. c’ indicates the direct effect of race with the outcome measures and c indicates the total effects. All values are for Black participants compared with White participants and adjusted for disease risk score. Positive values indicate greater pain or disability and negative values indicate less pain or disability. Total values for indirect effects may not equal the sum of their component values because of rounding.

