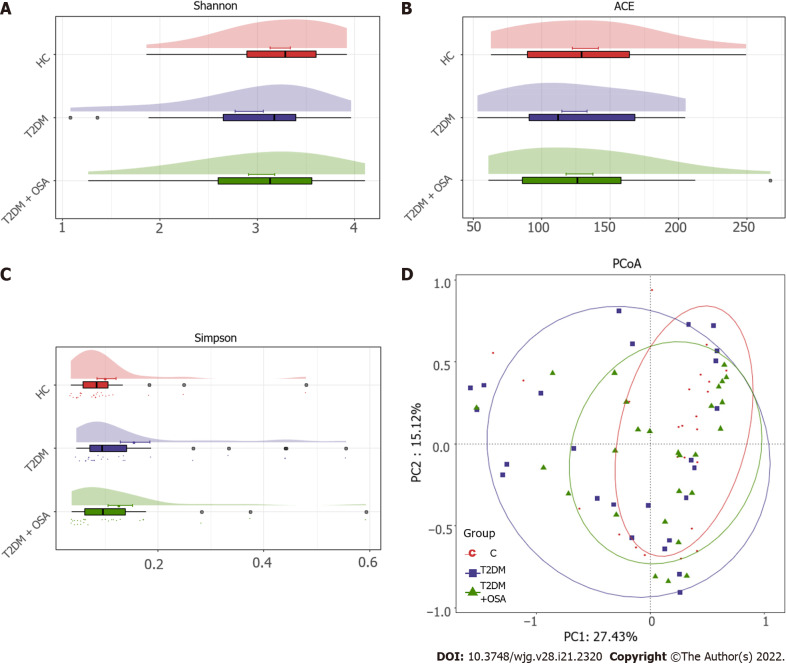
Figure 3.
The gut microbial diversity and structures of the gut microbiota in groups healthy control, type 2 diabetes mellitus, and type 2 diabetes mellitus plus obstructive sleep apnea. A: Shannon index; B: ACE estimator; C: Simpson index; D: Principal coordinates analysis plot of the gut microbiota among groups healthy control, type 2 diabetes mellitus, and type 2 diabetes mellitus plus obstructive sleep apnea. HC: Healthy control; T2DM: Type 2 diabetes mellitus; OSA: Obstructive sleep apnea.

