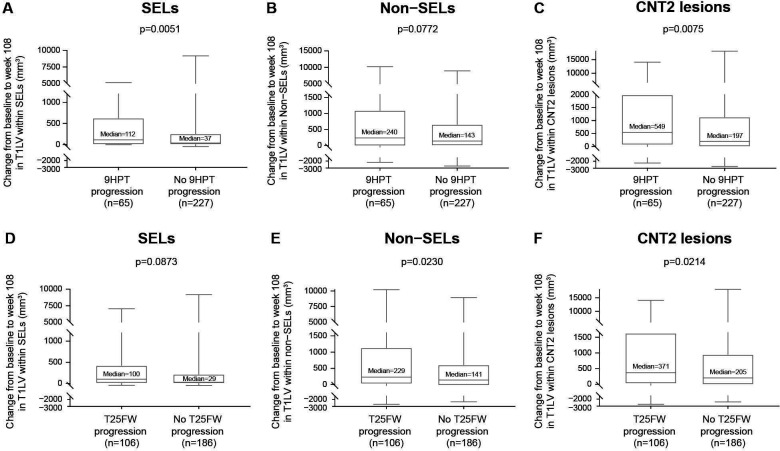
Figure 3.
Association between CLA and 9HPT progression and between CLA and T25FW progression. Change from baseline to week 108 in T1LV within (A) SELs and (C) CNT2 lesions but not (B) non-SELs was associated with 9HPT progression in patients with SPMS treated with placebo. (However, a consistent directional trend was observed in non-SELs.) Change in T1LV from baseline to week 108 within (E) non-SELs and (F) CNT2 lesions but not (D) SELs was associated with T25FW progression in patients with SPMS treated with placebo. (However, a consistent directional trend was observed in SELs.) 9HPT progression and T25FW progression were confirmed at 24 weeks and end of study. In these box-and-whisker representations, the box spans the interquartile range, the median is marked by the horizontal line inside the box and the whiskers are the two lines outside the box that extend to the highest and lowest observations. P values by Van Elteren test; stratified by baseline EDSS Score (≤5.5 or ≥6.0) and by baseline T2 lesion volume category based on tertiles (≤6908.79 mm3, >6908.79–18 818.49 mm3 and >18 818.49 mm3). 9HPT, 9-Hole Peg Test; CLA, chronic lesion activity; CNT2, chronic non-enhancing T2; EDSS, Expanded Disability Status Scale; SEL, slowly expanding lesion; SPMS, secondary progressive multiple sclerosis; T1LV, T1-hypointense lesion volume; T25FW, Timed 25-Foot Walk.

