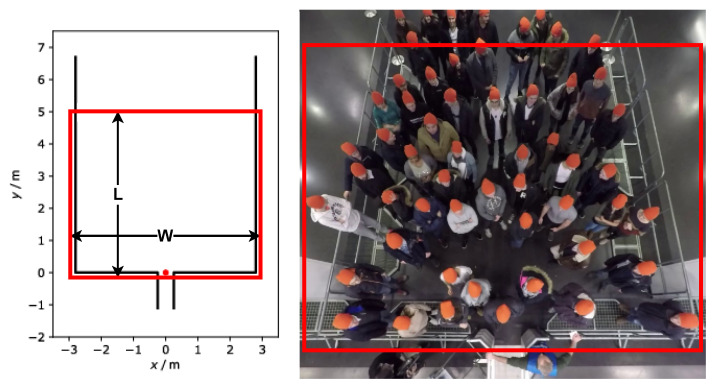
Figure 5.
ROI in the entrance. (Left) experimental setup with the red dot indicating the coordinate origin [42], (right) overhead view of an exemplary experiment. The original frame in the right image is from [42]. The entrance gate width is 0.5 m. The rectangle indicates the entrance area (ROI). L: length of ROI in m. According to the experiment, the width of the ROI (w) varies from 1.2 to 5.6 m.

