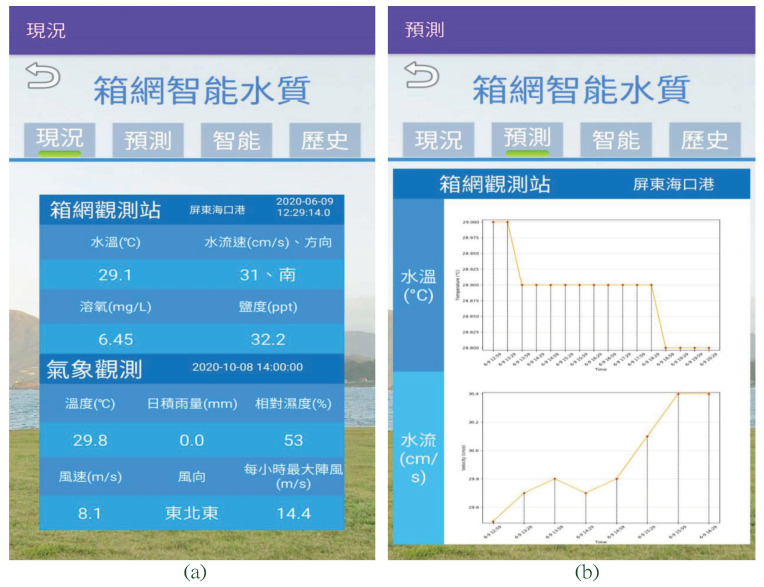
Figure 9.
Smart water quality prediction, (a) current information, cage monitoring (at the top half part): water temperature, water velocity, dissolved oxygen, and salinity (from left to right and top to bottom), and weather information (at the lower half part): temperature, daily rainfall, humidity, wind speed, wind direction, maximum showers per hour (from left to right and top to bottom), and (b) prediction information, water temperature (at the top half part), and water velocity (at the lower half part).

