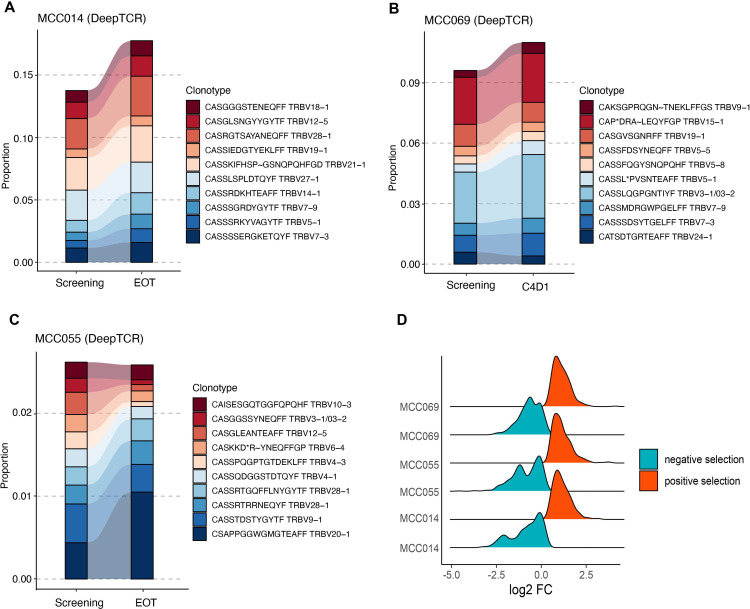
Figure 4.
The combination therapy induces clonotype modulation in CR patients, represented by the top clonotype profiles. (A–C) Tracking the relative abundance (estimated from DeepTCR) of top 10 most abundant clonotypes in three patients in CR: (A) MCC014(A), (B) MCC069, and (C) MCC055. (D) The density distribution of TCR aa sequences under positive and negative selection after the combination therapy. The log2FC (fold-change) is calculated by log2 transformation of clonotype (relative) frequency fold-change between EOT and pretreatment time points. CR, complete response; EOT, end of treatment; TCR, T cell receptor.

