
Figure 1.
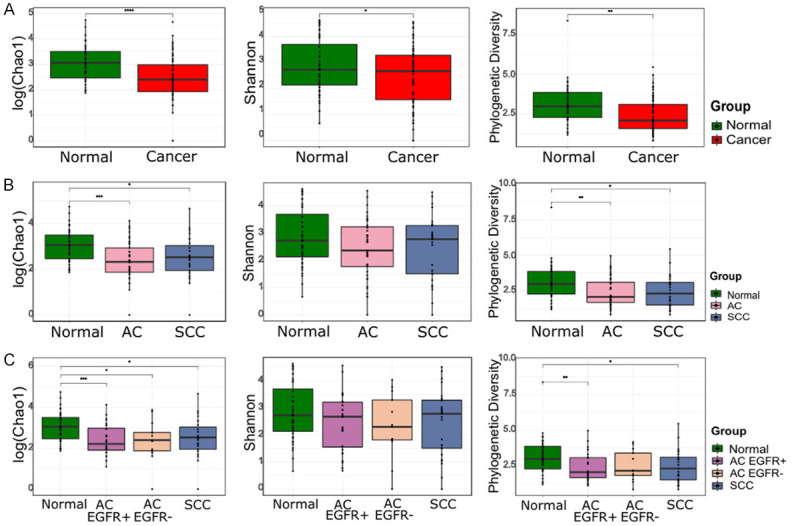
Comparison of the alpha diversity indexes (Chao1, Shannon, and phylogenetic diversity) between lung cancer and normal lung tissues. (A) Normal vs. Cancer, (B) Normal vs. AC vs. SCC, and (C) Normal vs. AC EGFR+ vs. AC EGFR- vs. SCC. Box plot represents the minimum, first quartile, median, third quartile, and maximum of the alpha indexes.