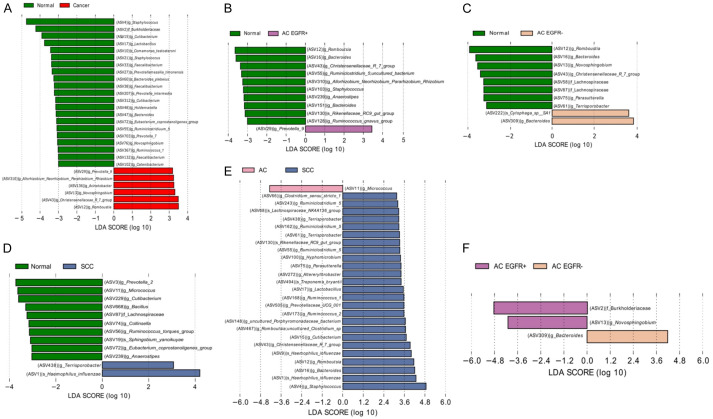
Figure 2.
The linear discriminant analysis effect size plots of bacterial communities in cancer and normal lung tissues. Linear discriminant analysis scores were calculated, with higher scores indicating a greater effect size (significance determined by an LDA score > 3.0 and a p < 0.05 in the Kruskal-Wallis rank-sum test). Taxonomic categories include f = family, g = genus, and s = species. (A) Normal vs. Cancer, (B) Normal vs. AC EGFR+, (C) Normal vs. AC EGFR-, (D) Normal vs. SCC, (E) SCC vs. AC, and (F) AC EGFR+ vs. AC EGFR-.

