Figure 2.
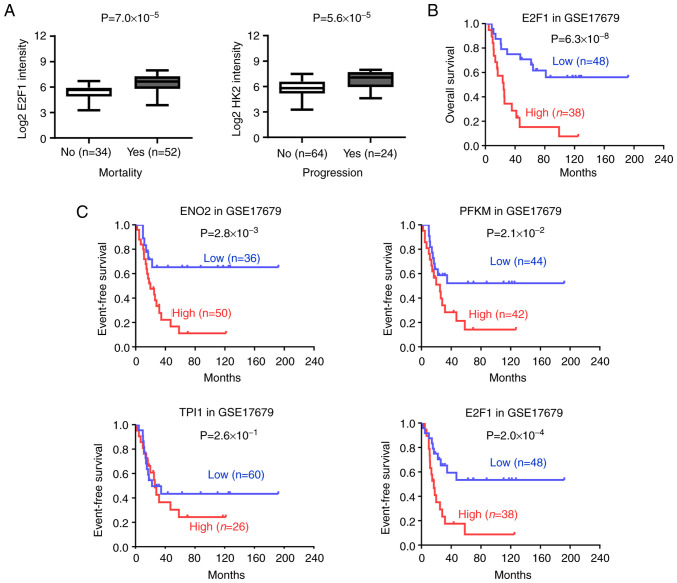
Expression of E2F1 and glycolytic genes in tumor tissues. (A) The relative E2F1 levels in EWS (GSE17679) with the mortality and progression. (B) Kaplan-Meier curves showing the overall survival in EWS (GSE17679) with high or low expression of E2F1 (cutoff values=5.998). (C) Kaplan-Meier curves showing the overall survival in EWS (GSE17679) with high or low expression of ENO2, PFKM, TPI1, and E2F1 (cutoff values=7.347, 9.177, 10.900 and 5.998). Student's t-test compared the difference in panel A. Log-rank test for survival comparison in panels B and C. E2F1, E2F transcription factor 1; EWS, Ewing sarcoma.

