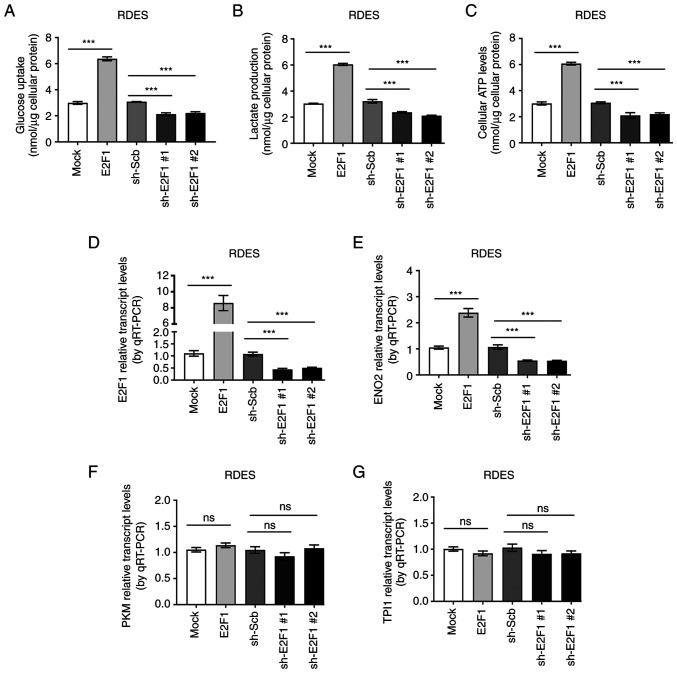
Figure 3.
E2F1 regulates aerobic glycolysis. The levels of (A) glucose uptake, (B) lactate production and (C) cellular ATP levels were detected in RDES cells upon the transfection of the indicated plasmids. Reverse transcription-quantitative PCR (normalized to β-actin, n=3) revealing the transcript levels of (D) E2F1, (E) ENO2, (F) PFKM and (G) TPI11 in RDES cells treated with stably transfected as indicated. Student's t-test compared the difference in Mock vs. E2F1. One-way ANOVA followed by post-hoc Bonferroni's test was used to compare the difference in sh-Scb vs. sh-E2F1 #1 or sh-E2F1 #2. ***P<0.001 vs. Mock or sh-Scb; ns, no significance; E2F1, E2F transcription factor 1; sh, short hairpin.

