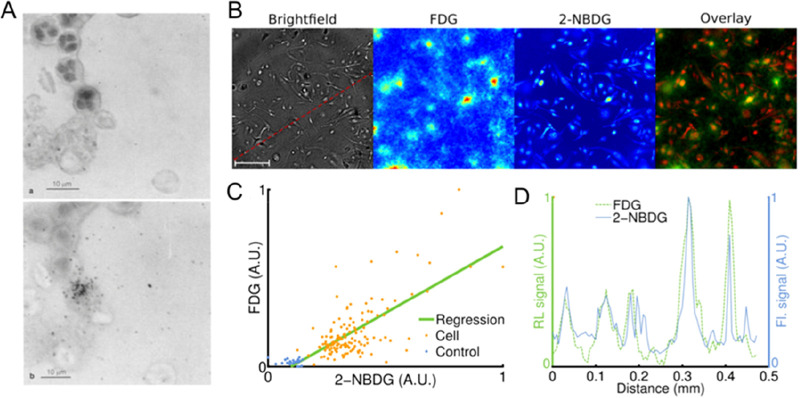
Figure 17.
Single-cell analysis of radiotracer uptake. (A, left panels) Microautoradiograph of a typical labeled neutrophil (labeled with [99mTc]Tc-SnF2) showing diffuse grain pattern, smear preparation, (a) cells in focus, and (b) silver grains in focus. Reproduced with permission from Puncher and Blower, ref (202). Copyright 1995 Springer Nature. (B) Radioluminescence imaging of [18F]FDG uptake in single cells. Human breast cancer cells (MDA-MB-231) were deprived of glucose for 1 h, incubated for 1 h with [18F]FDG (400 μCi) and 2-[N-(7-nitrobenz-2-oxa-1,3-diaxol-4-yl)amino]-2-deoxyglucose (2-NBDG, 100 μM), and then washed. (B) Brightfield (scale bar, 100 μm), radioluminescence ([18F]FDG), and fluorescence (2-NBDG) micrographs. Overlay, showing colocalized radioluminescence (green) and fluorescence (red). (C) Scatter plot comparing FDG and 2-NBDG uptake, computed over 140 cells (light red dots) and 26 control ROIs (blue dots). The green line was obtained by linear regression (correlation, r = 0.74). Arbitrary units (A.U.). (D) Radioluminescence (FDG) and fluorescence (2-NBDG) intensity profile shown along a line [red dashed line in panel B]. Reproduced with permission from Pratx et al., ref (271). Copyright 2012 PLOS under CC license [https://creativecommons.org/licenses/by/4.0/].

