Figure 19.
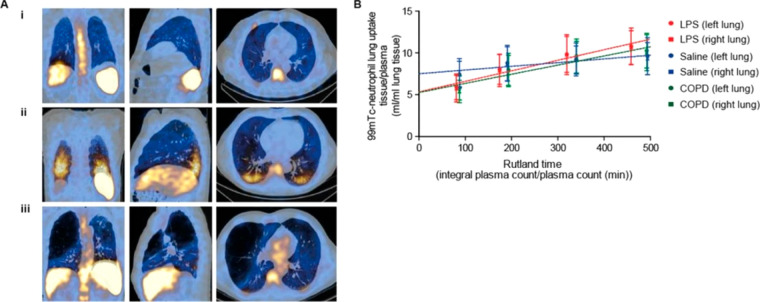
Radiolabeled neutrophils in COPD. (A) SPECT/CT images (coronal, sagittal, and transverse views, respectively) from (i) a saline-challenged healthy volunteer, (ii) an LPS-challenged healthy volunteer, and (iii) a patient with COPD. The large airspaces, with negligible radioactivity, are black and can be seen in the emphysematous lung (iii). (B) Composite Patlak–Rutland graphical plot in saline-challenged healthy volunteers, LPS-challenged healthy volunteers and patients with COPD. The plot gradient represents blood clearance of 99mTc-neutrophils to the lungs in mL/min/mL lung volume. The y-axis intercept corresponds to the 99mTc-neutrophil distribution volume. The profiles for COPD patients and LPS-treated subjects are similar to each other and markedly different from saline-treated healthy subjects. Adapted with permission from Tregay et al., ref (318). Copyright Tregay et al. 2019. Published by BMJ under CC license [https://creativecommons.org/licenses/by/4.0/].

