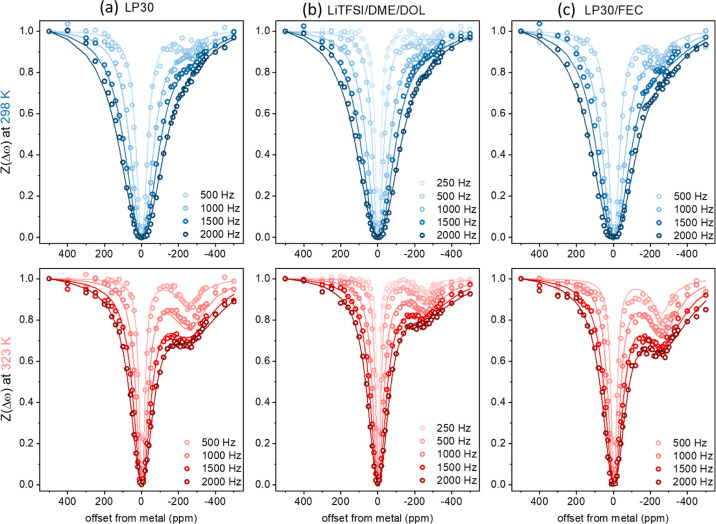
Figure 5.
Experimental Z-spectra (circles) acquired from dendrites grown and immersed in (a) LP30, (b) LiTFSI/DME/DOL, and (c) LP30/FEC as a function of saturation amplitude with a 0.2 s saturation pulse at 298 and 323 K. Data were fitted (solid lines) by solving the two-pool BMC equation. Fit parameters are given in Table 2.

