Figure 2.
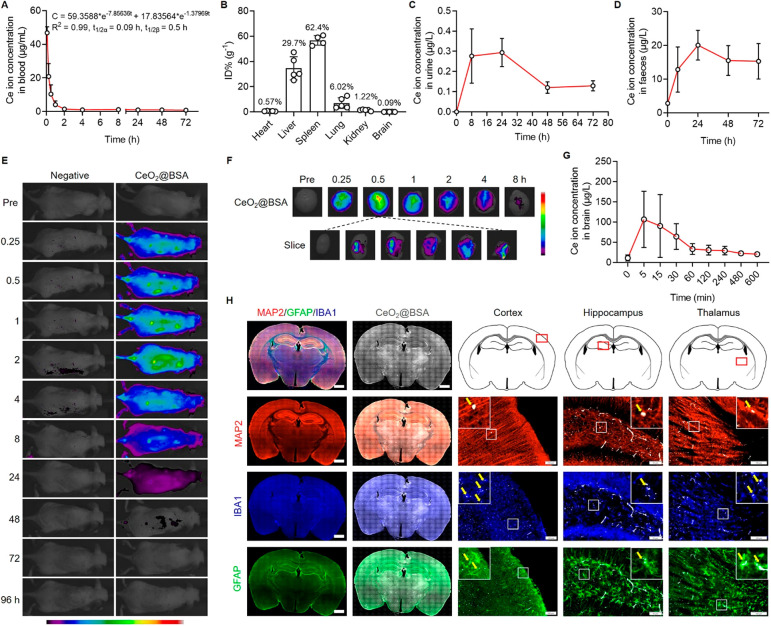
CeO2@BSA nanoclusters exhibit BBB penetration capacity. (A) In vivo blood pharmacokinetics curve. (B) Biodistribution of CeO2@BSA nanoclusters in major tissues in mice post administration for 30 min. Excreted Ce ion concentration in mouse (C) urine and (D) feces. (E) In vivo fluorescence images of control mouse (left) and mouse treated with Cy5-labeled CeO2@BSA nanoclusters. (F) Fluorescence images of brain tissue post Cy5-labeled CeO2@BSA nanocluster administration. (G) Ce ion concentration in normal mouse brain (after perfusion). (H) Immunofluorescent staining of mouse brain (MAP2, IBA1, and GFAP for neuron, microglia, and astrocyte, respectively). Scale bar: 1 mm for entire brain slice and 100 μm for the others. Data are shown as mean ± SD.

