Figure 1.
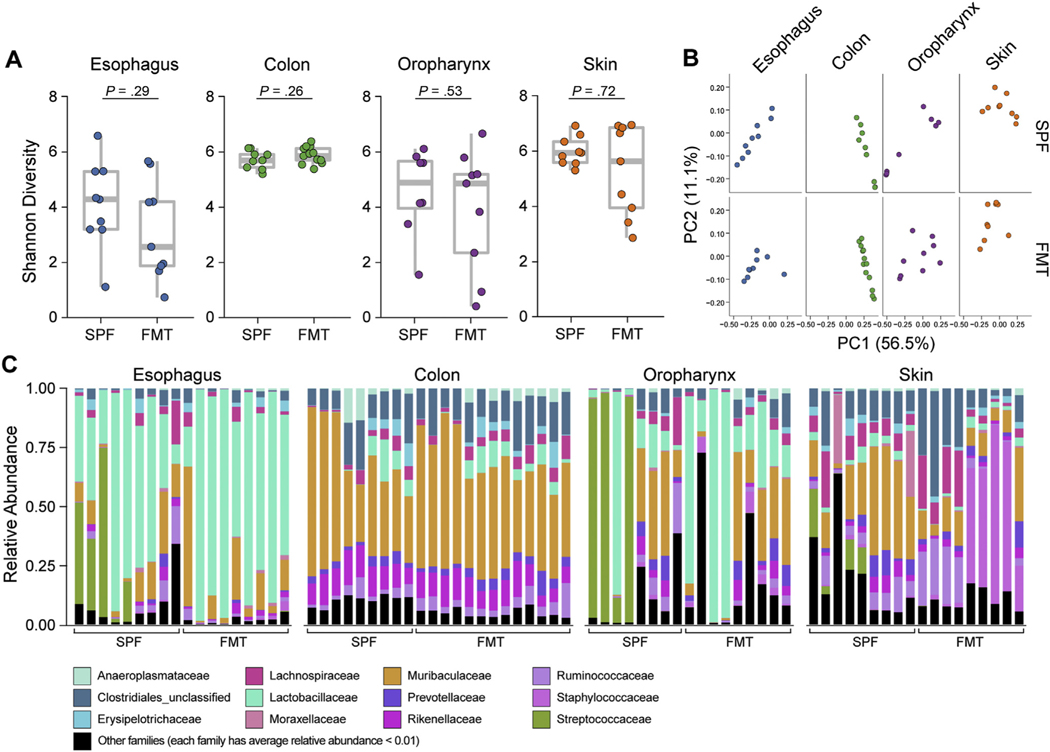
Esophageal FMT feasibility and efficacy. 16S rRNA analysis of esophagus, colon, oropharynx, and skin from 8-week-old FMT mice compared with PHF SPF littermates of the FMT donor mice (inclusive of the donor): (A) α-diversity (Shannon index) of microbiota at indicated sites. (B) β-diversity PCoA of microbiota at indicated sites with weighted UniFrac distance. (C) Taxonomic composition of bacterial taxa at the family level. Each vertical bar or dot represents 1 individual mouse. Data are pooled from 2 independent experiments; n = 18 for each tissue (72 samples total): SPF, n = 9; FMT, n = 9 (esophagus, oropharynx, and skin) and n = 13 colon. Mann-Whitney U test was used in (A).

