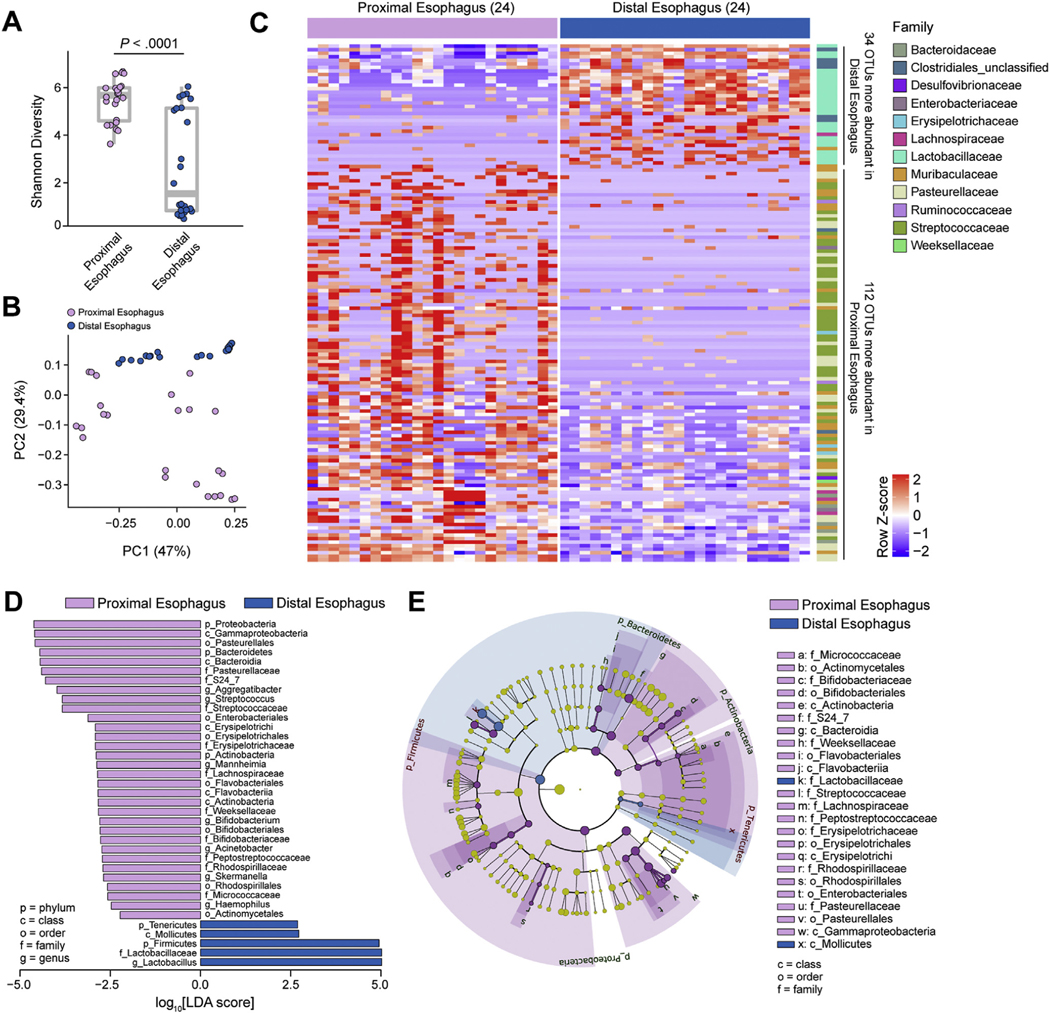
Figure 4.
Microbiota profiles of the DE and PE. 16S rRNA analysis from DE and PE of 8-week-old SPF littermates (see Supplementary Table 4): (A) α-diversity (Shannon index) of microbiota at indicated sites. (B) β-diversity PCoA of microbiota at indicated sites with weighted UniFrac distance. (C) Heatmap of differentially abundant OTUs between sites (discrete false discovery rate [DS-FDR] 0.10; Supplementary Table 1) labeled at the family level (right). (D) Linear discriminant analysis effect size (LEfSe) of bacterial taxa enriched at indicated sites. (E) Phylogenetic analysis of esophageal microbiota at indicated sites. (A–E) Data are pooled from 3 independent experiments; n = 24 for each site (48 total samples): 24 for DE and 24 for PE. Mann-Whitney U test was used in (A), DS-FDR in (C), and Kruskal-Wallis test in (D). LDA, linear discriminant analysis.

