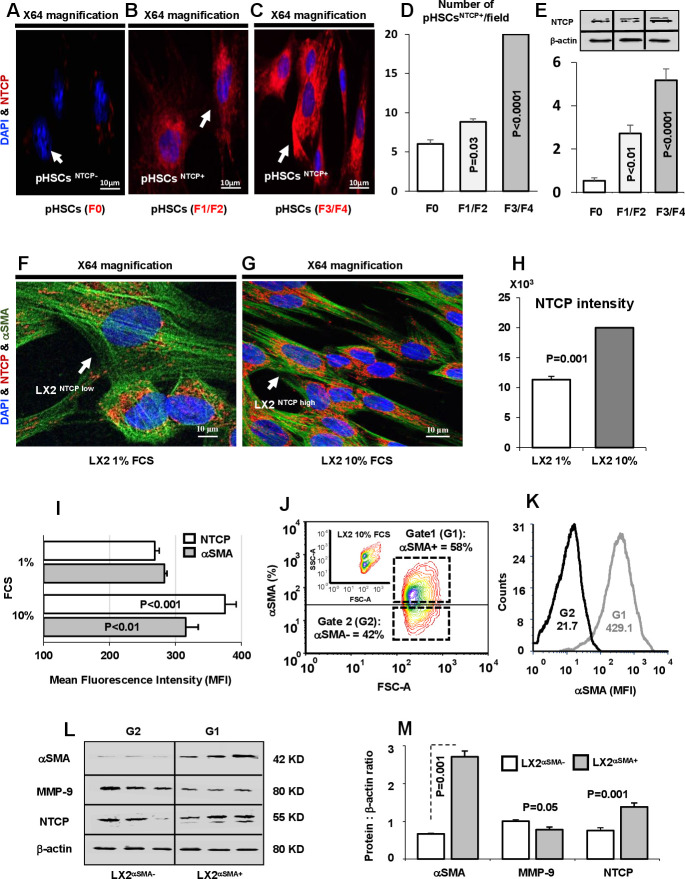
Figure 1.
Activated primary hepatic stellate cells (pHSCs) and LX2 exhibit high expression of NTCP. Confocal microscopy of NTCP expressions on pHSCs obtained from liver biopsies of patients with liver fibrosis with (A) F0 score, (B) F1/F2 score and (C) F3/F4 score. pHSCs are shown as follows: DAPI for nucleus staining (blue), Cy-3 conjugated NTCP (red). (D) pHSCs expressing NTCP were enumerated and presented as pHSCsNTCP+/field. (E) Quantitated western blot analysis of NTCP in pHSCs obtained from F0, F1/F2 and F3/F4 patients with liver fibrosis. (F) Confocal microscopy of NTCP expressions on LX2 cells incubated with 1% FCS; naive state and (G) 10% FCS; activated state. LX2 cells are shown as follows: DAPI for nucleus staining (blue), Cy-2 conjugated αSMA (green), Cy-3 conjugated NTCP (red). (H) Confocal microscopy quantitation of NTCP represented as colour intensities in the 1% and 10% FCS treatments. (I) Averages of flow cytometry analysis of NTCP and αSMA mean fluorescence intensity (MFI) for LX2 cells incubated with 1% or 10% FCS. (J) Representative flow cytometry diagram showing sorted LX2 subpopulation according to αSMA expression (LX2αSMA−: gate 1 (G1) and LX2αSMA+: gate 2 (G2)). The upper small diagram represents LX2 cells categorised by size (forward-scattered; FSC) and granularity (side-scattered; SSC). (K) Representative flow cytometry histogram of αSMA-MFI following LX2 subpopulation sorting displayed by αSMA expression (LX2αSMA−: gate 1 (G1) and LX2αSMA+: gate 2 (G2)). (L) Bands of western blots of NTCP and fibrosis markers (MMP-9 and αSMA) in sorted LX2αSMA subpopulation. (M) Averages of protein quantification of NTCP and fibrosis markers (MMP-9 and αSMA) in sorted LX2αSMA subpopulation. αSMA, alpha smooth muscle actin; FCS, fetal calf serum; NTCP, sodium taurocholate cotransporting polypeptide.

