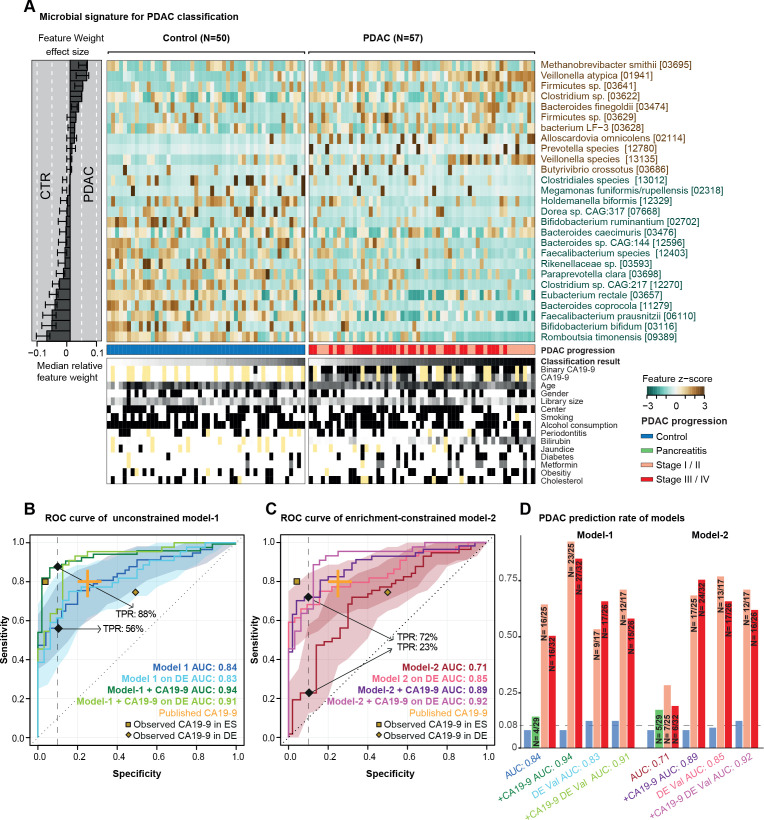
Figure 2.
Predictive microbiome signatures of pancreatic ductal adenocarcinoma (PDAC). (A) Normalised abundance of 27 selected species in the faecal microbiome across samples shown as a heat map. The right panel represents the contribution of each selected feature to the overall model-1, and the robustness (the percentage of models in which the feature is included as predictor) of each feature is presented as percentage. Classification scores from cross-validation of each individual and condition for tested meta-variables are displayed at the bottom of the panel, yellow representing missing information. (B–D) Internal cross-validation results of unconstrained model-1 (without feature selection), enrichment-constrained model-2 (constrained to positive features) and combination of carbohydrate antigen (CA)19-9 (using a threshold of 37 μL/mL) with microbial features (see ‘Methods’) are shown as receiver operating characteristic (ROC) curve with 95% CI shaded in corresponding colour. True positive rates (TPRs) are given as a percentage at a 90% specificity cut-off. Validation of all models on an independent German (DE) PDAC test population (n=76) is represented as well. Published CA19-9 accuracy from a meta-study shown in orange. The yellow dots represent observed CA19-9 accuracies in our populations (data available for 33/50 controls (CTRs) and 44/57 patients with PDAC in the Spanish (ES) and for 8/32 CTRs and 44/44 patients with PDAC in the German (DE) population) (D) TPRs of all models at different PDAC progression stages and in addition, the false-positive rate for patients with chronic pancreatitis and controls at a 90% specificity cut-off are shown as bar plots. Stages I and II and stages III and IV are combined owing to the overall low sample size. The number of predicted cases compared with the total is also shown on the top of each bar. DE-Val, German validation population.

