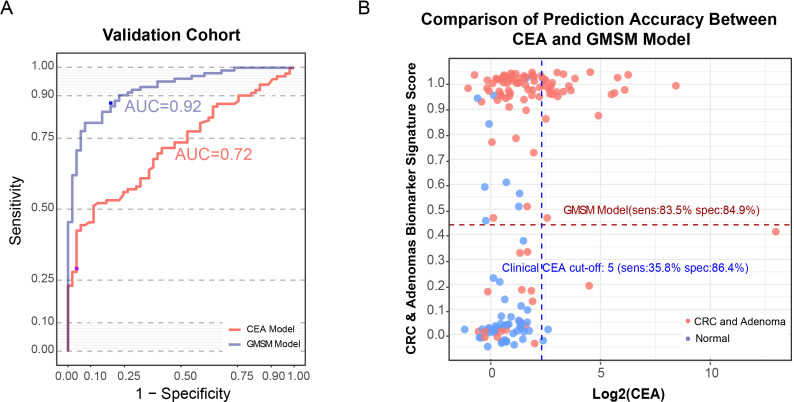
Figure 5.
Comparing performances of the CRC GMSM model and the CEA biomarker. (A) ROC curve showing the discrimination accuracy of CEA (red line, AUC=0.72; sensitivity 35.8%, specificity 86.4% using clinical cut-off, labelled by the purple point) and the CRC GMSM model (blue line, AUC=0.92, sensitivity 83.5%, specificity 84.9% under the cut-off score of 0.438, labelled by the blue point) in the validation cohort. (B) Scatter plot for the graphical comparison of the GMSM model (red dashed line) and CEA (clinical cut-off, blue dashed line) accuracy in discriminating the normal individuals (green spots) and abnormal colorectal patients (red spots) in the validation cohort. With a similar level of specificity, the sensitivity of our GMSM model is greatly superior to that of the CEA marker. CEA, carcinoembryonic antigen; CRC, colorectal cancer; GMSM, gut microbiome-associated serum metabolites; ROC, receiver operating characteristic.

