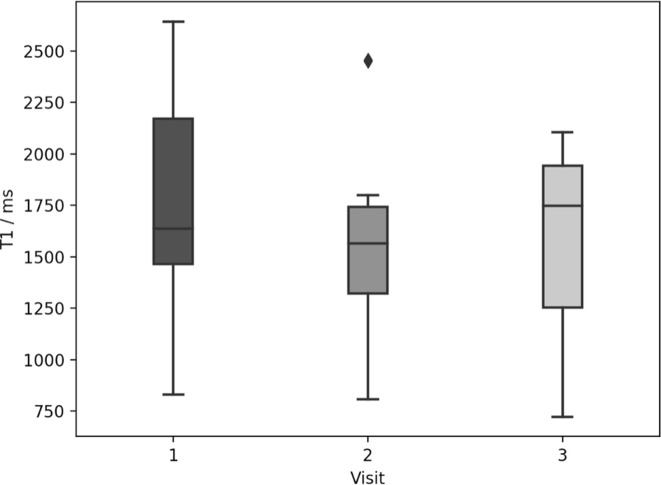
Figure 2.
Box plot showing median T1 (box middle line), lower and upper quartiles (box edges) and data range (whiskers) over all patients for three visits. Outliers are shown as diamonds. There was a significant difference between median T1 at visit 2 compared with visit 1 (Wilcoxon signed ranks test, p=0.008). No other significant differences were detected.

