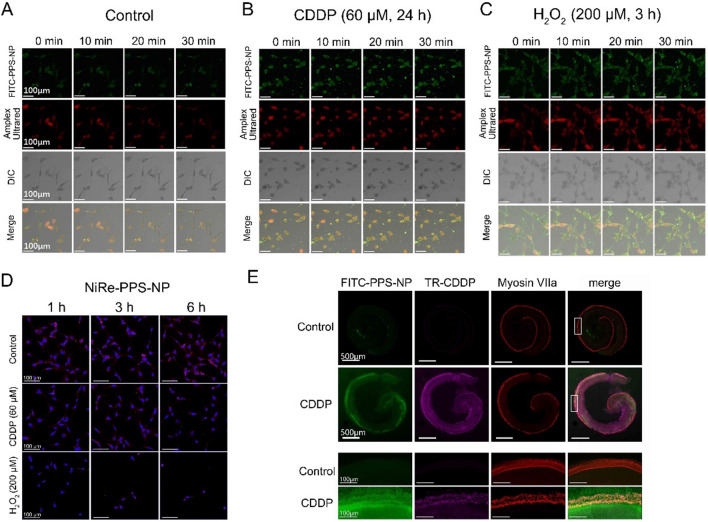
Fig. 3.
ROS-responsive accumulation and release profile in HEI-OC1 cells and cultured Organ of Corti. A–C Live cell imaging of cellular uptake of FITC-PPS-NP within 30 min under CDDP (60 μM, 24 h) stimulation, H2O2 (200 μM, 3 h) as a positive control. D Confocal images showed the Nile Red fluorescence changed at various time points in control or CDDP (60 μM) treated HEI-OC1 cells, H2O2 (200 μM) as a positive control. E Representative confocal images of cochlear explants. Texas Red (TR) and FITC fluorescence respectively labeled CDDP and NP, while Myosin VIIa labeled hair cells

