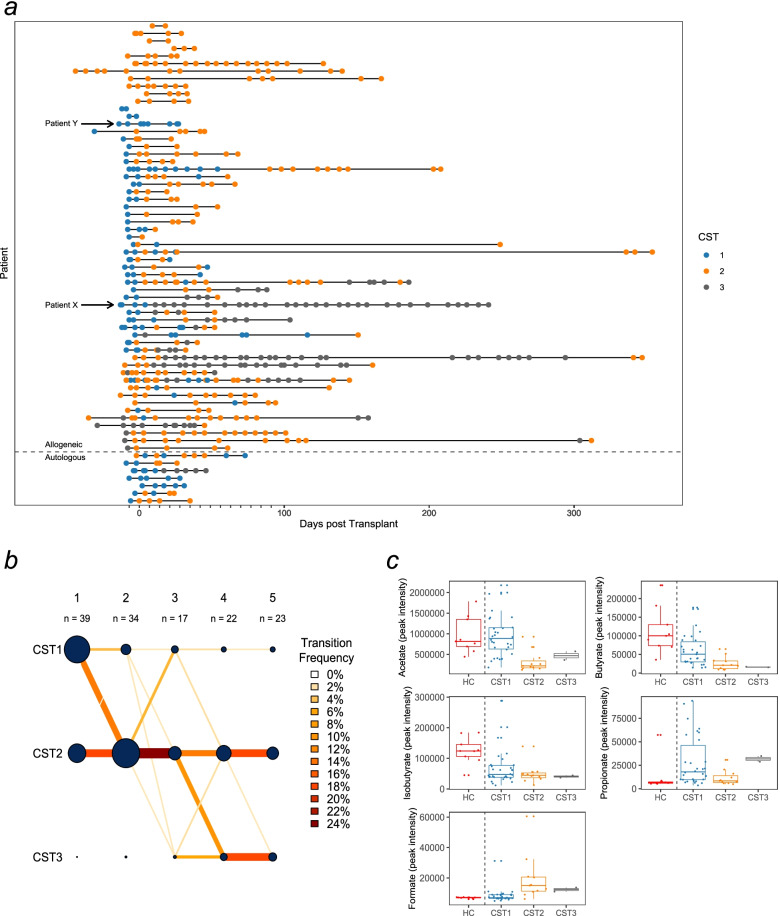
Fig. 3.
Community state type transitions and metabolome makeup at baseline. a) A timeline of all samples collected in the study, coloured by the CST they have been classified into. Extra demarcations on the x-axis denote weekly intervals. b) A transition model showing the progression of samples through each CST at each time point starting at day -7 relative to transplantation (week 1) to week 4 post-transplantation. Line colour intensity is indicative of transition frequencies, and the node sizes correspond to sample size within each node. c) SCFA and formate in baseline samples split by their respective CST

