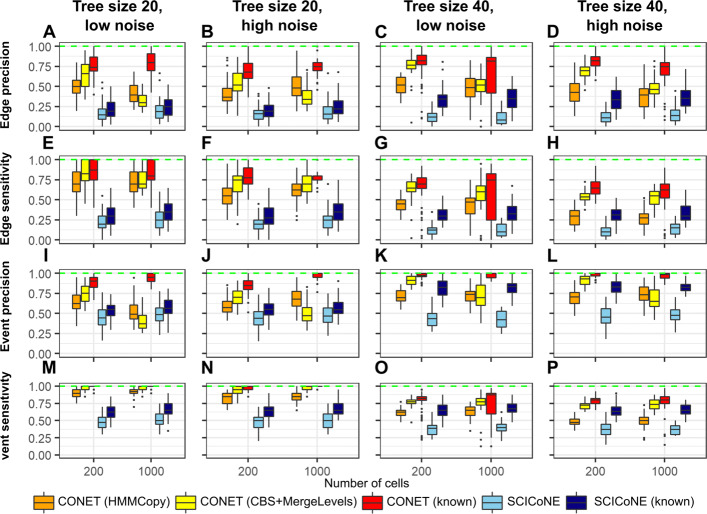
Fig. 2.
Comparative assessment of the tree structure inference for simulated data tests results. A–D Distribution of edge precision (y-axis) depending on the cell number (x-axis) for all simulation scenarios: smaller tree size (first and second column) versus larger tree size (third and fourth column), low noise (first and third column) versus high noise (second and fourth column). E–H Distribution of edge sensitivity (y-axis) depending on the cell number (x-axis) for all scenarios. I–L Distribution of event precision (y-axis) depending on the cell number (x-axis) for all scenarios. M–P Distribution of event sensitivity (y-axis) depending on the cell number (x-axis) for all scenarios. Optimal values of the presented quality measures are marked with a green dashed line in each plot

