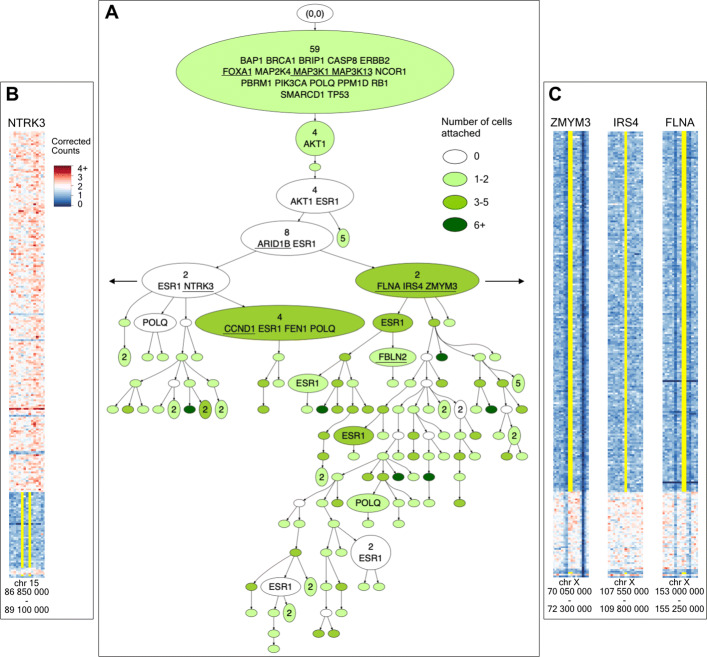
Fig. 4.
CONET for SA501X3F xenograft breast cancer data set. A The CONET is drawn in a compacted form, with part of vertices collapsed when it is possible without losing important information, i.e. when the collapsed vertex has no cells attached and not more than one child. Specifically, the collapsed vertex is joined with its closest descendant that does not satisfy these criteria (number of events is shown at the beginning of joint vertices). This results in decreasing the tree size from 225 to 131. The number of cells attached to each vertex is illustrated with different colors, where white vertices have no cells attached and the darker green indicates more cells attached. The names of the breast cancer genes [67] affected by the CN events are printed in alphabetical order in the corresponding vertices. Underlined genes appear only once in the CONET. B, C Enlarged parts of corrected counts matrix heatmap, with areas of the genome surroundinng the coding regions of such breast cancer genes that divide the cells into two distinctive subpopulations. The yellow lines are the borders of each of the genes’ coding regions, drawn for cells that have CN change of the gene in question, according to their attachment in the CONET

