
Fig. 11.
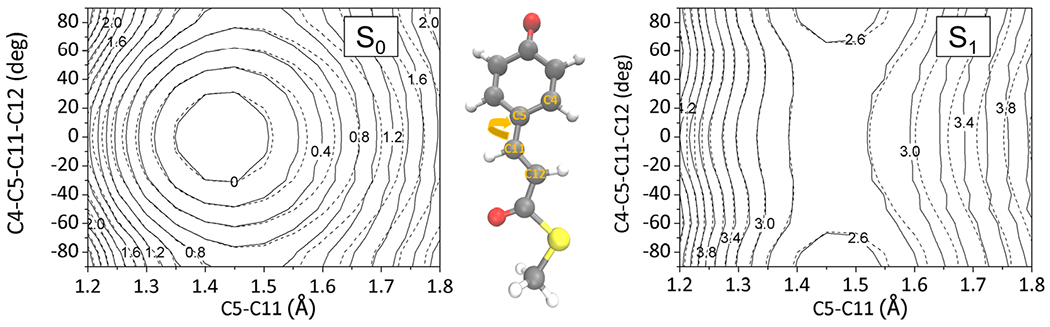
Reliability of interpolated PES: contour maps of the interpolated S0 and S1 state surfaces (solid lines) of the PYP chromophore in comparison with the reference quantum chemical data (dashed lines). Energy values are denoted in eV units. The contours were drawn by varying a torsional angle and its coupled bond length around the S0-optimized geometry as denoted with the molecular structure. The interpolation data points were sampled in an iterative manner by adopting excited-state molecular dynamics simulations. The size of the interpolation data set was 2100.