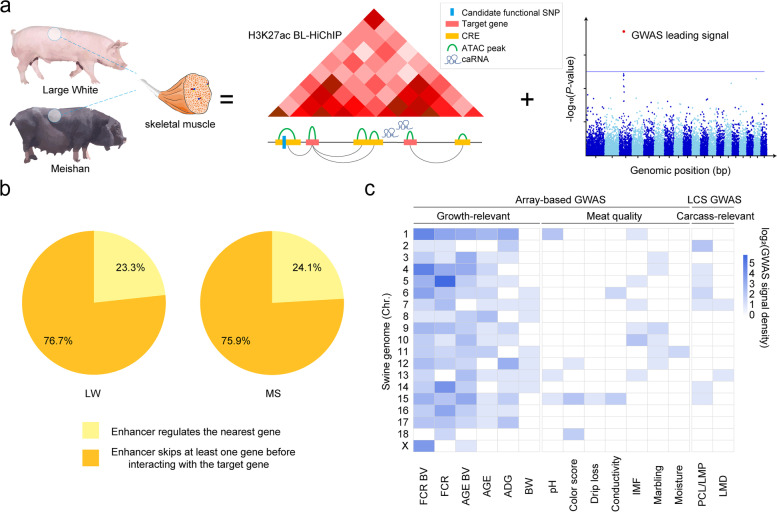
Fig. 1.
Study design and features of epigenetic landscape of skeletal muscle in LW and MS. a Integrated analyses based on enhancer-promoter interaction maps and GWAS leading signals. b Pie charts showing that 75–76% enhancers chose to skip over their nearest gene to regulate target genes in a long-range manner. c GWAS leading signals of 15 muscle-associated traits. The first category was growth-related traits, including feed conversion ratio (FCR), average daily gain (ADG), days to 100 kg (AGE), body weight (BW), and breeding values of FCR and AGE. The second category was meat quality-related traits, consisting of meat color score, conductivity, drip loss, marbling score, moisture, pH, and intramuscular fat (IMF). The last category was carcass-associated traits, including loin muscle depth at 100 kg (LMD) and lean meat percentage at 100 kg (LMP/PCL)

