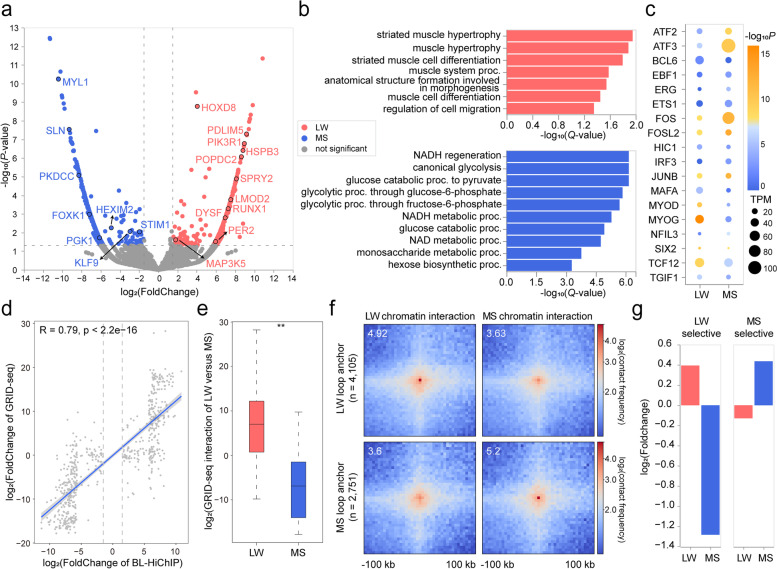
Fig. 3.
Differential chromatin-chromatin interactions and RNA–chromatin interactions. a Volcano plots showing chromatin loop up-regulated genes in LW and MS. b Top GO BP (biological process) terms enriched with LW and MS up-regulated genes by g:Profiler. Top enriched GO terms are ranked by the negative log10 (Q-value). c Enrichment of TF motifs on loop anchors of up-regulated genes in LW and MS. The color of each dot denotes the degree of enrichment (calculated as the cumulative binomial distribution by HOMER), and the size of each dot indicates the expression level of the corresponding TF. d Scatter plot showing that the differences in chromatin-chromatin interaction and RNA-chromatin interaction levels were positively correlated between LW and MS (Pearson correlation, n = 665 promoters). The trend line from linear regression is shown. e Change in RNA-chromatin interactions of differential loop-regulated promoters between LW (n = 328) and MS (n = 337), single-tailed Wilcoxon test with P values < 2.2×10⁻¹⁶. f Aggregate BL-HiChIP heatmap around differential caRNA-regulated genes and associated loop anchors based on RNA-chromatin interaction levels in LW (n = 4105) and MS (n = 2751). g Bar plot of LW up-regulated genes enriched in LW selective regions and not in MS selective regions, and vice versa for MS

