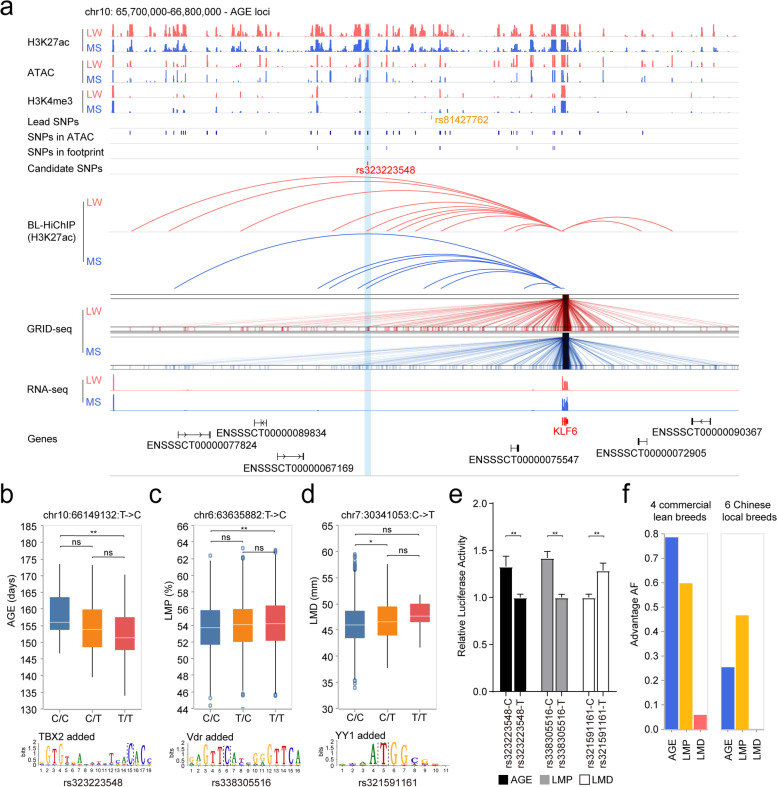
Fig. 5.
Validation of newly-identified candidate functional SNPs. a IGV plot of AGE trait regulated by candidate functional SNP based on multi-omics analysis. b Phenotypic differences of AGE (days to 100 kg) in a population of 182 LW individuals with different genotypes. The number of animals with different genotypes for AGE: nC/C = 21, nC/T = 31, and nT/T = 130. Outliers are shown as individual dots. Statistical significance is determined by single-tailed Mann-Whitney U test. The predicted motif affected by the candidate functional SNP is shown at the bottom, and the locus of this SNP is highlighted by black dotted line. c, d Phenotypic differences of LMP (Lean meat percentage at 100 kg) and LMD (Loin muscle depth at 100 kg) in a population of 2869 Duroc individuals with different genotypes. The number of animals with different genotypes for LMP: nC/C = 344, nT/C = 1306, and nT/T = 1135. The number of animals with different genotypes for LMD: nC/C = 2456, nC/T = 328, and nT/T = 11. Outliers are shown as individual dots. Statistical significance is determined by single-tailed Mann-Whitney U test. The predicted motifs affected by the candidate functional SNPs are shown at the bottom, and the locus of SNPs is highlighted by black dotted line. e The alternative alleles exhibited significantly higher luciferase activity compared to the reference alleles. f Distribution of frequency of target alleles with enhanced phenotypic performance for AGE, LMP, and LMD traits

