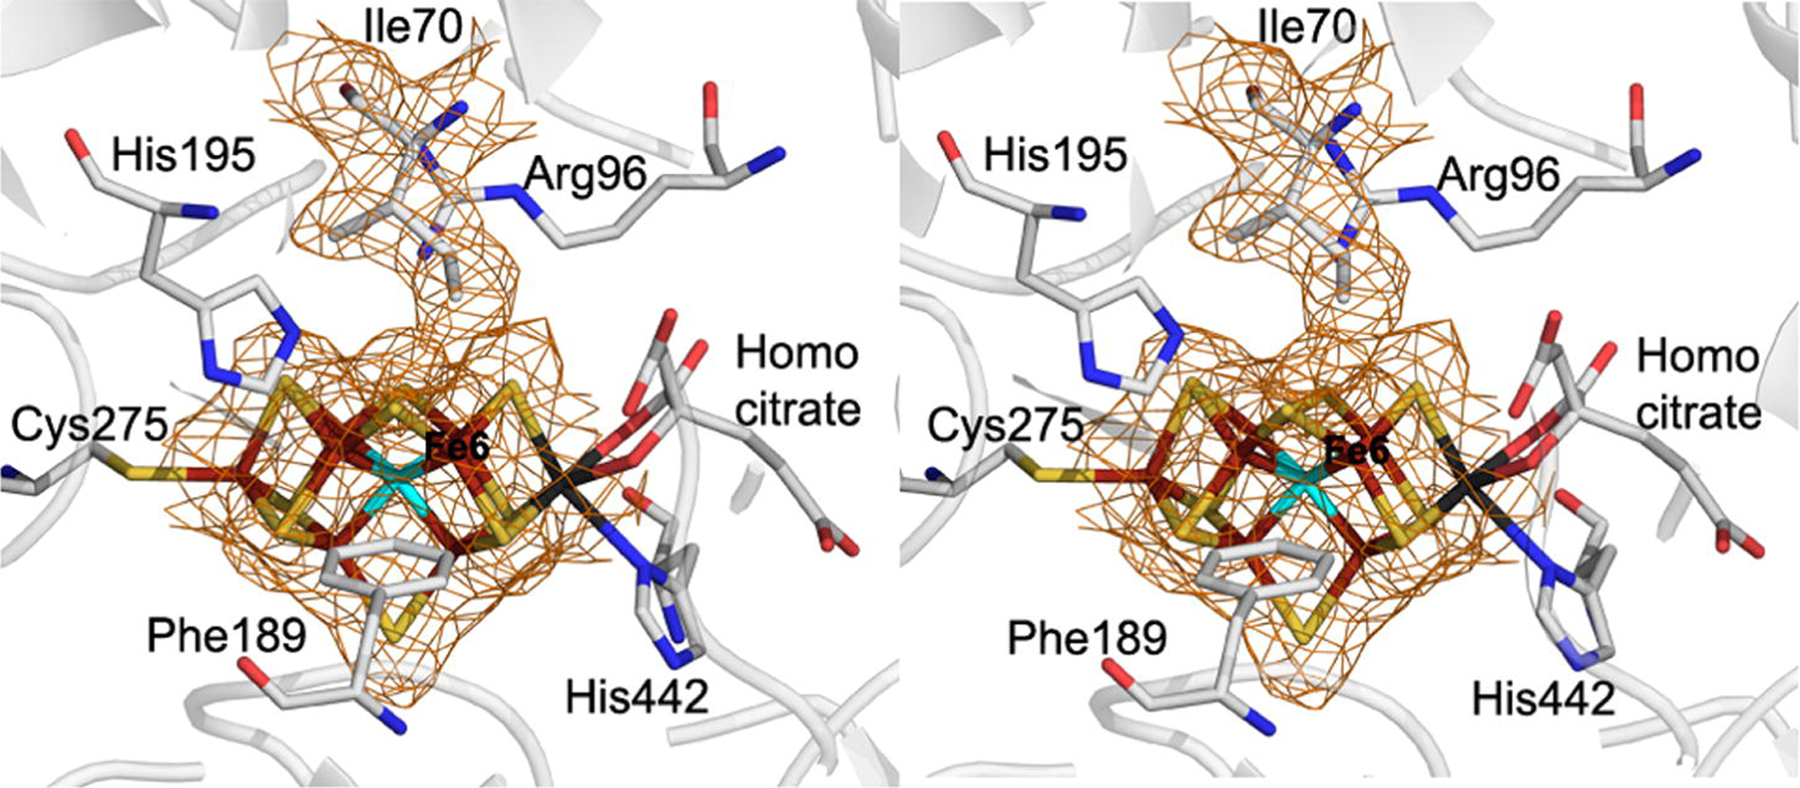
Figure 2:

Stereoview of the 2Fo-Fc electron density maps (1.0σ) of the region surrounding the FeMo-cofactor and the adjacent α-70Ile residue. The protein backbone is shown in ribbons with residues in the FeMo-cofactor environment from the α-subunit are shown in line angle representations color coded with Fe in rust, S in yellow, C in grey, N in blue, O in red, and Mo in black.
