
Figure 3:
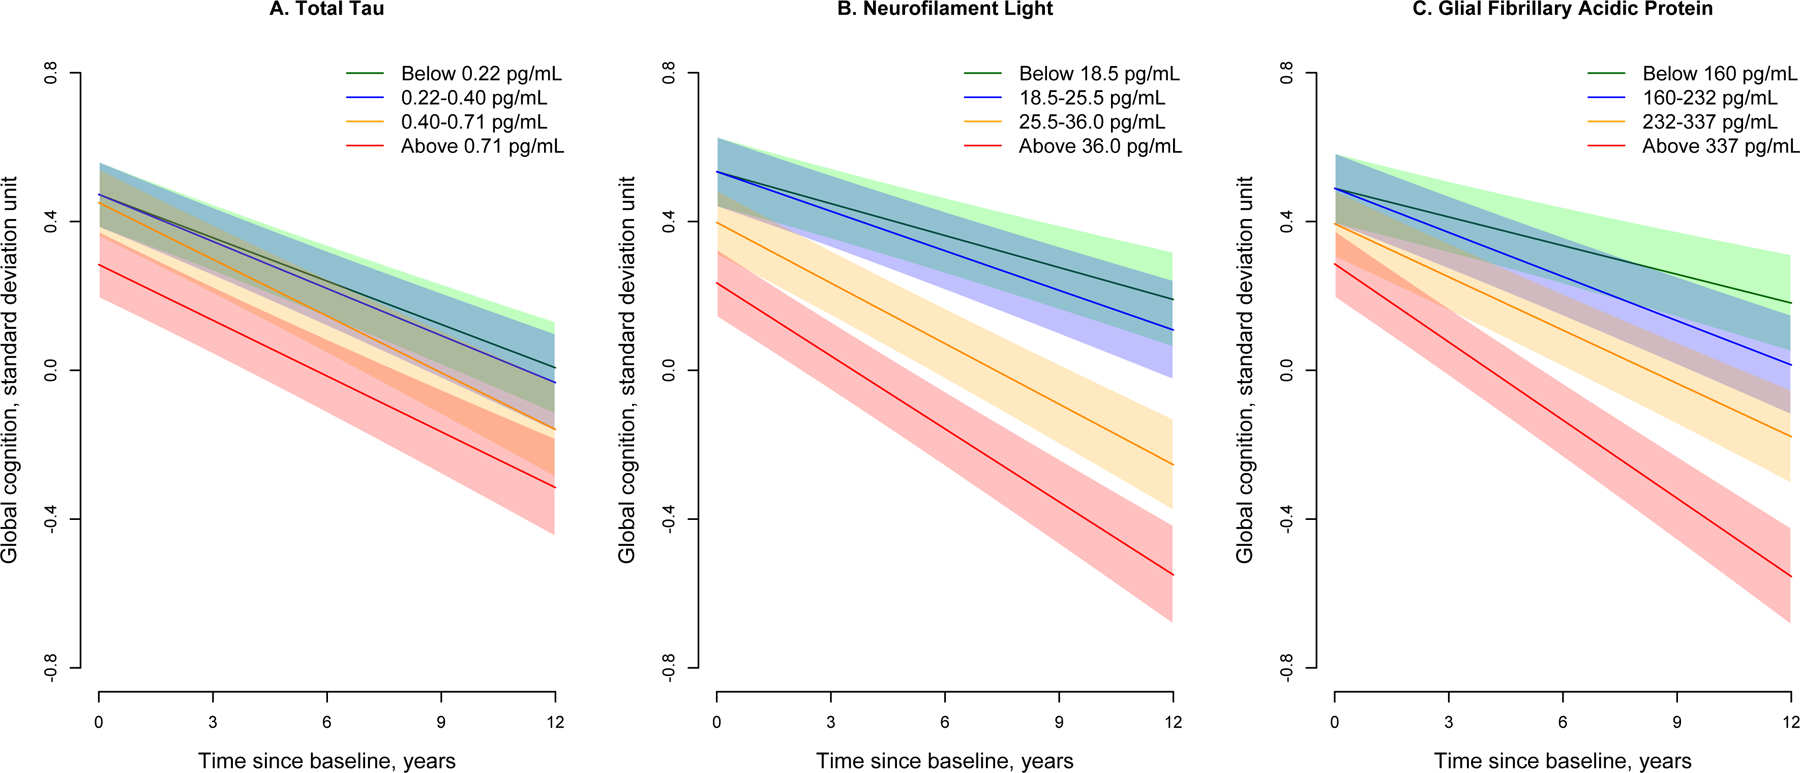
Longitudinal Trajectories of Global Cognition for Quartiles of Serum Total Tau, Neurofilament Light, and Glial Fibrillary Acidic Protein in 1,327 Participants from a Biracial Population Sample
Cognitive trajectories are based on linear mixed effects regression models adjusted for age, gender, race/ethnicity, education, and the presence of the APOE ε4 allele. Green line shows the lowest quartile, blue shows the 2nd quartile, orange shows the 3rd quartile, and red shows the highest quartile of biomarker concentrations. The 95% confidence bands for predicted cognitive scores are also shown.