Figure 1.

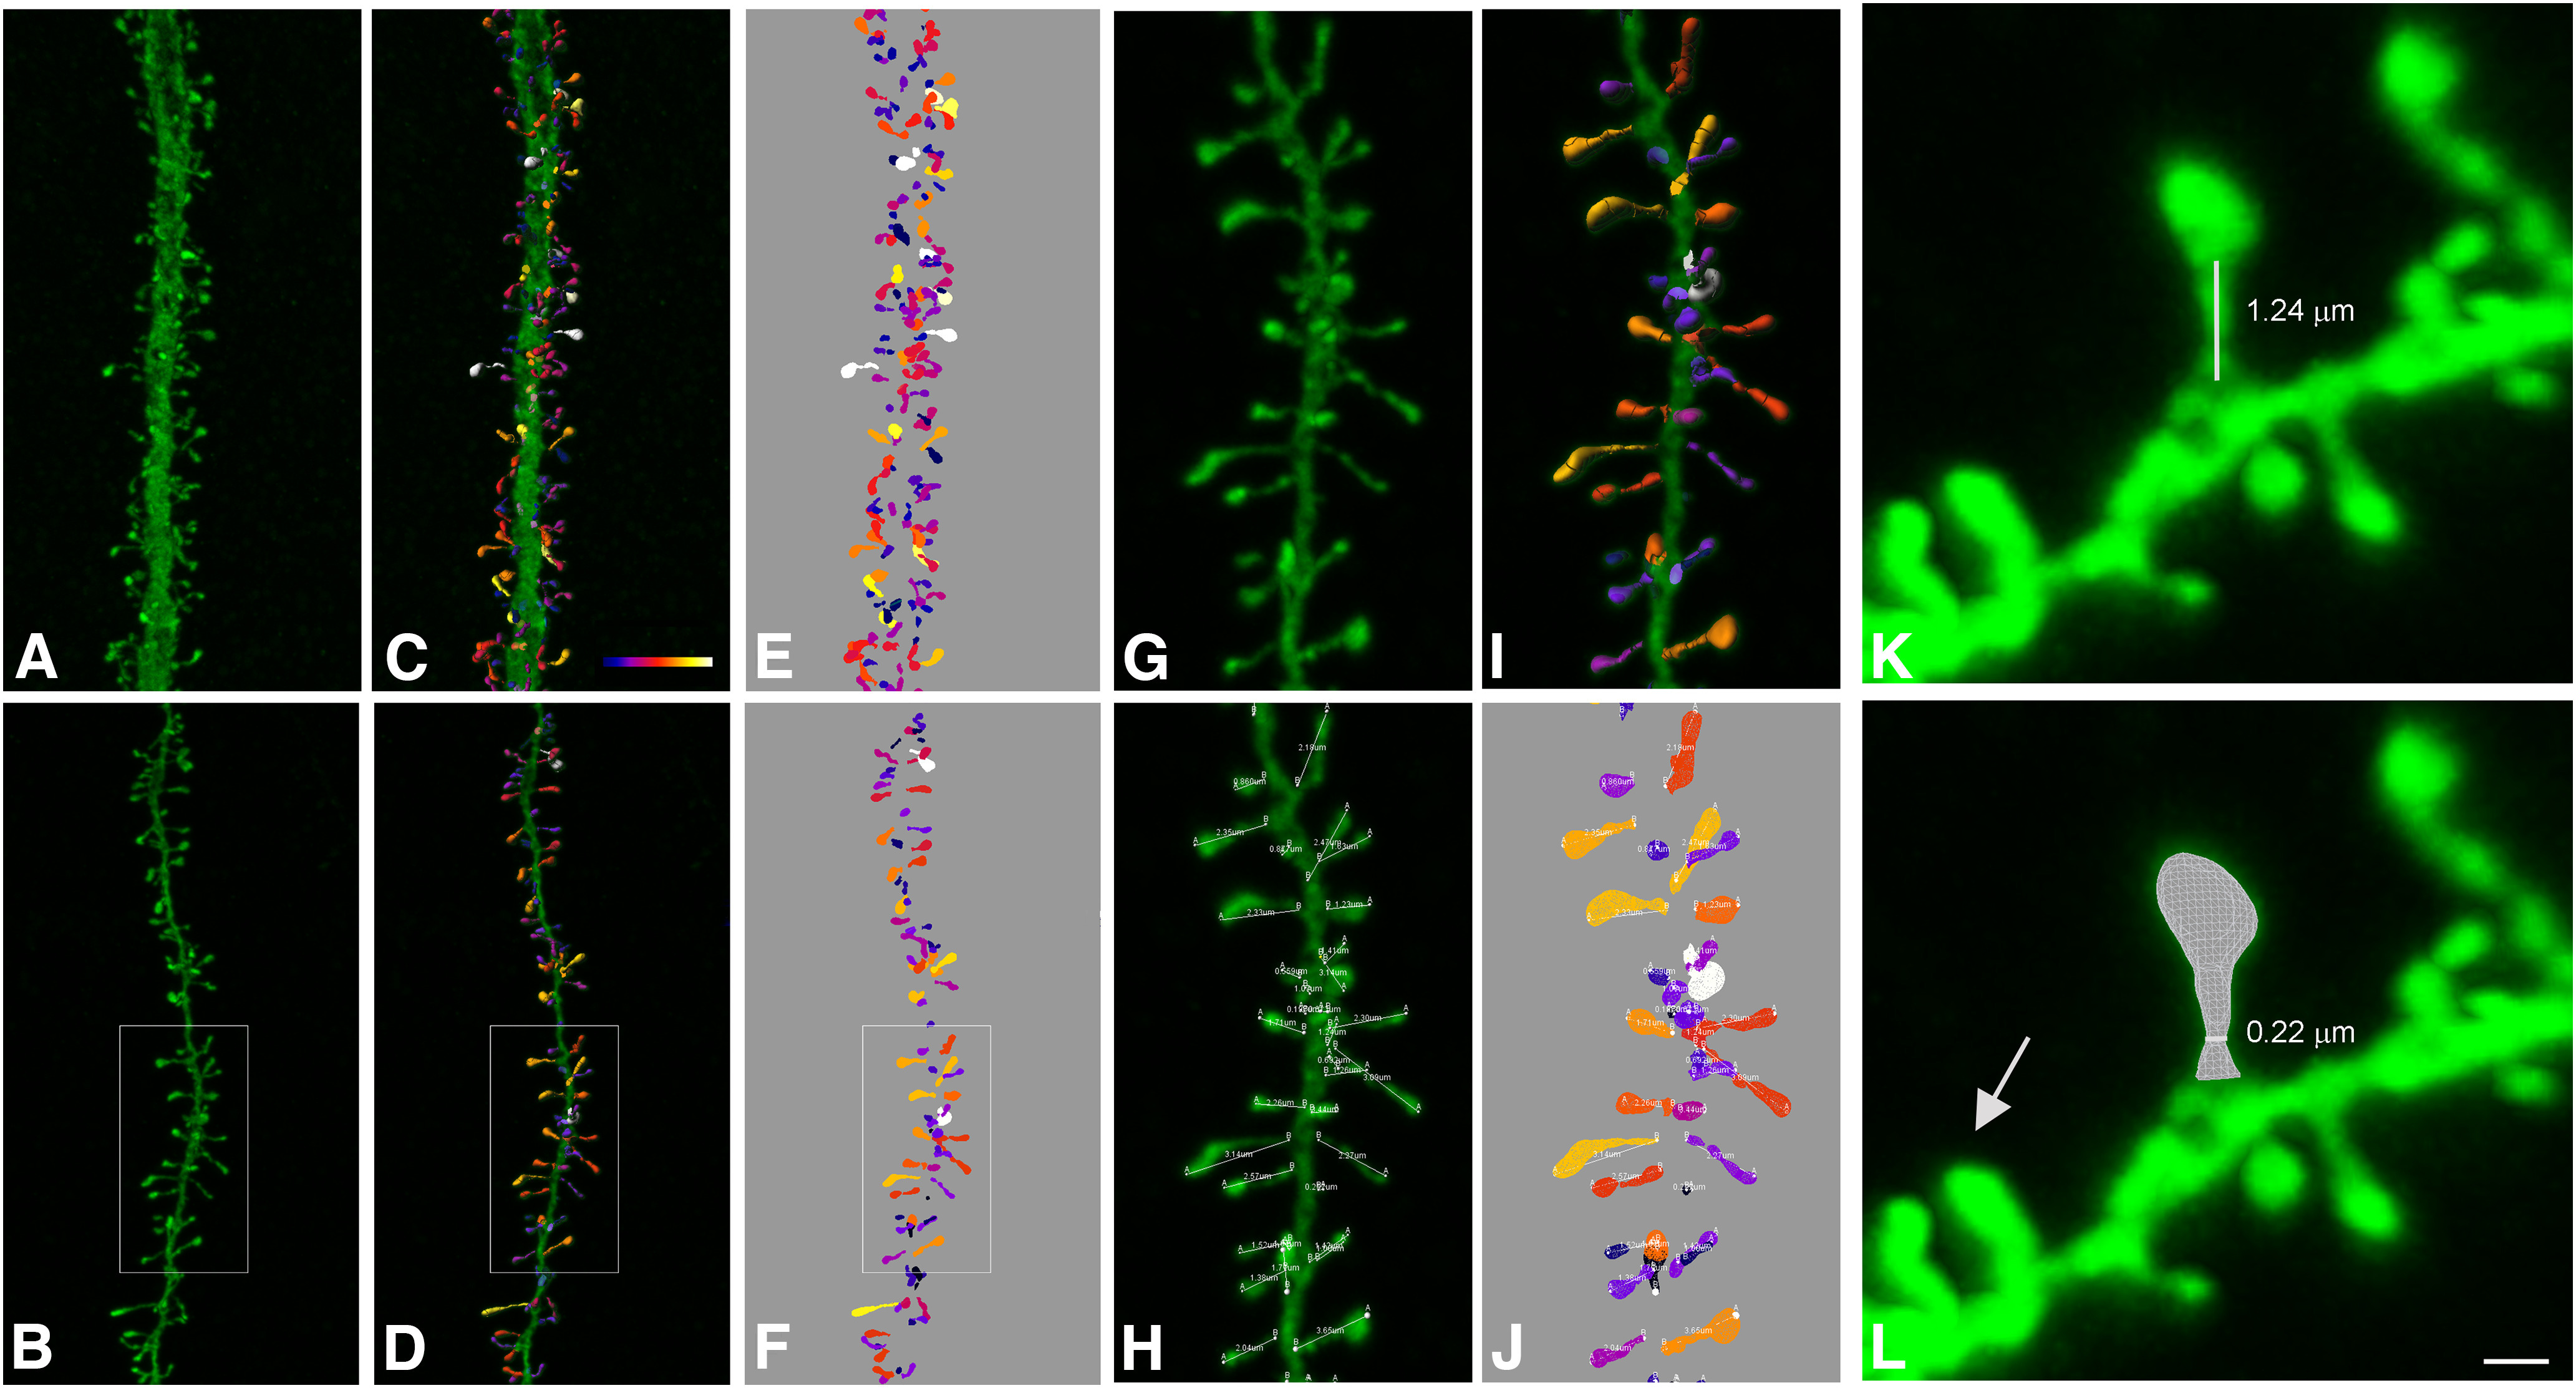
Spine reconstruction from confocal microscopy images. A, B, Apical (A) and basal (B) dendritic segments from intracellularly injected layer 3 pyramidal neurons from the human cingulate cortex. C, D, 3D reconstruction of each dendritic spine from the dendritic segment shown in A, B. Estimation of the spine volume values is shown by color codes (blue-white: 0–0.896 μm3). E, F, Surface meshes that were manually created for each individual spine. G–J, Higher magnification images of the dendritic segment shown in B. Spine lengths (that were measured in 3D) are also illustrated in H, J. K, Example of a typical spine showing a clear head and neck. White line shows neck length. L, Illustrates the corresponding surface mesh. White line shows neck diameter. Arrow indicates a spine not showing a clear head and neck. Dynamic scale bar (presented in L): 5 μm (A–F), 2 μm (G–J), and 0.6 μm (K, L).
