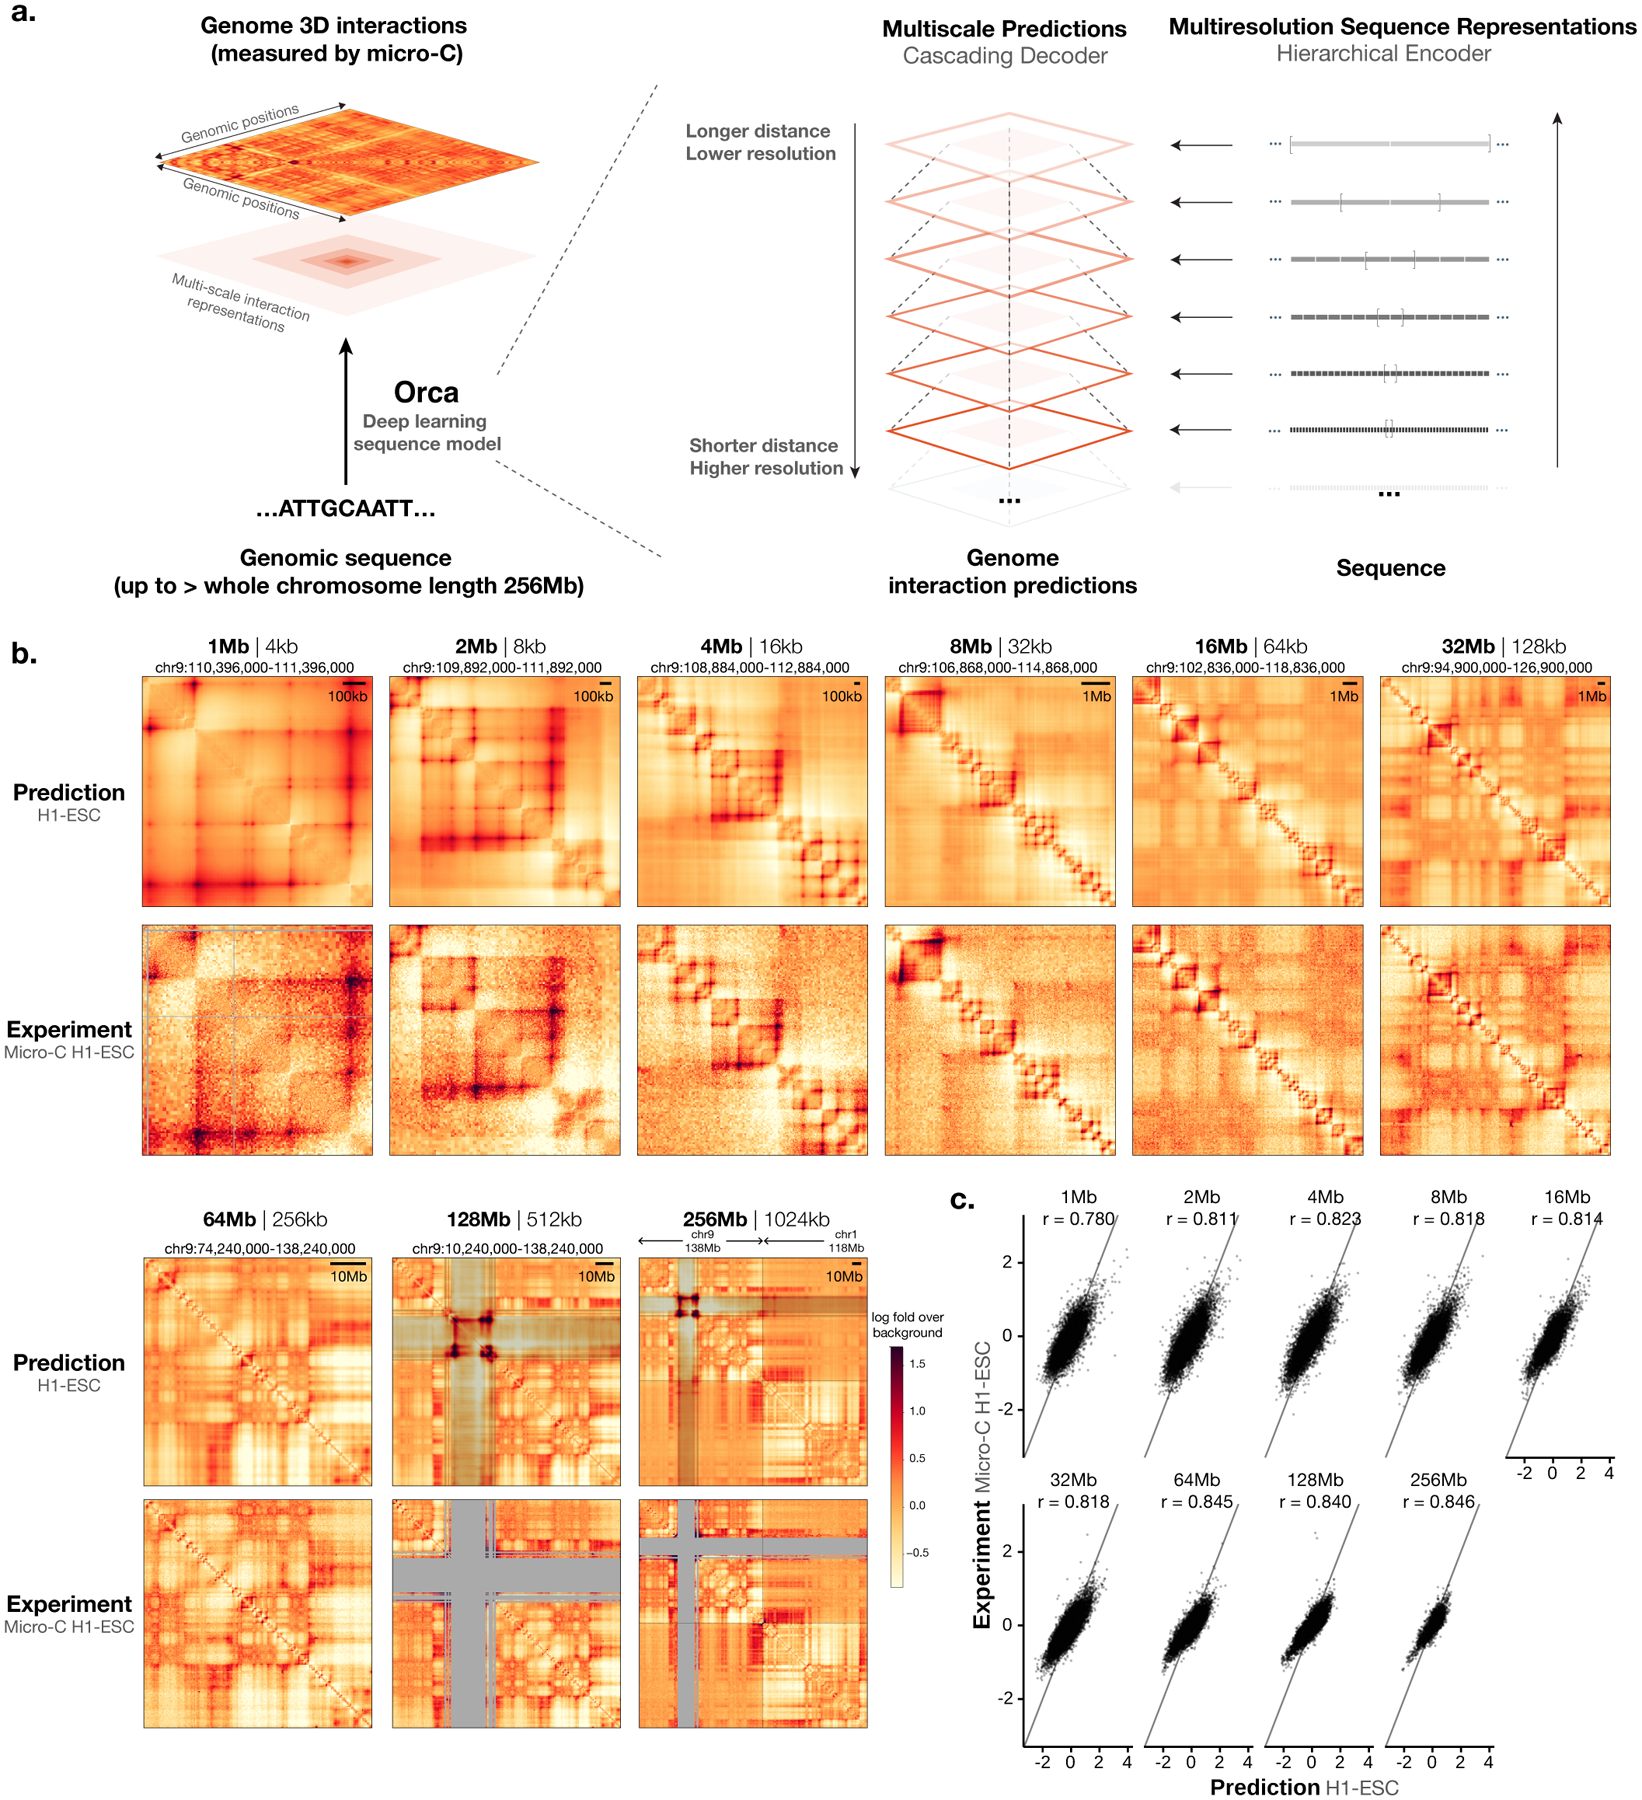
Fig. 1. Predicting multiscale 3D genome architecture from sequence.

a) Schematic overview of the deep learning model architecture for genome interaction prediction across all scales. Sequence representations at multiple resolutions are computed by a hierarchical encoder starting from the sequence in a bottom-up (high resolution to low resolution) order, whereas genome interaction matrices are predicted from both the corresponding levels of sequence representation and the higher-level genome interaction prediction in a top-down order (low resolution to high resolution). b) Multiscale sequence-based prediction example zooming from the whole-chromosome into a position on a holdout test chromosome. Predictions from 1–256-Mb scales are compared with micro-C experimental observations. Missing values in micro-C data due to lack of coverage are shown in gray, and these regions are also indicated in the 64–256-Mb predictions because the predictions at major assembly gaps or unmappable regions are of unknown accuracy. The genome interactions are represented by the log fold over genomic-distance-based background scores for both the prediction and the experimental data. The predictions for the same regions for the HFF cell type are also shown in Extended Data Figure 1. c). Scatter plot comparison of the predicted interaction scores with the micro-C measured interaction scores on the holdout test chromosomes. 10,000 randomly subsampled scores are shown in each panel. The overall Pearson correlations across the entire test chromosomes are also annotated. Predictions for 1–32-Mb levels are from the Orca 32-Mb model and 64–256-Mb levels are from the Orca 256-Mb model.
