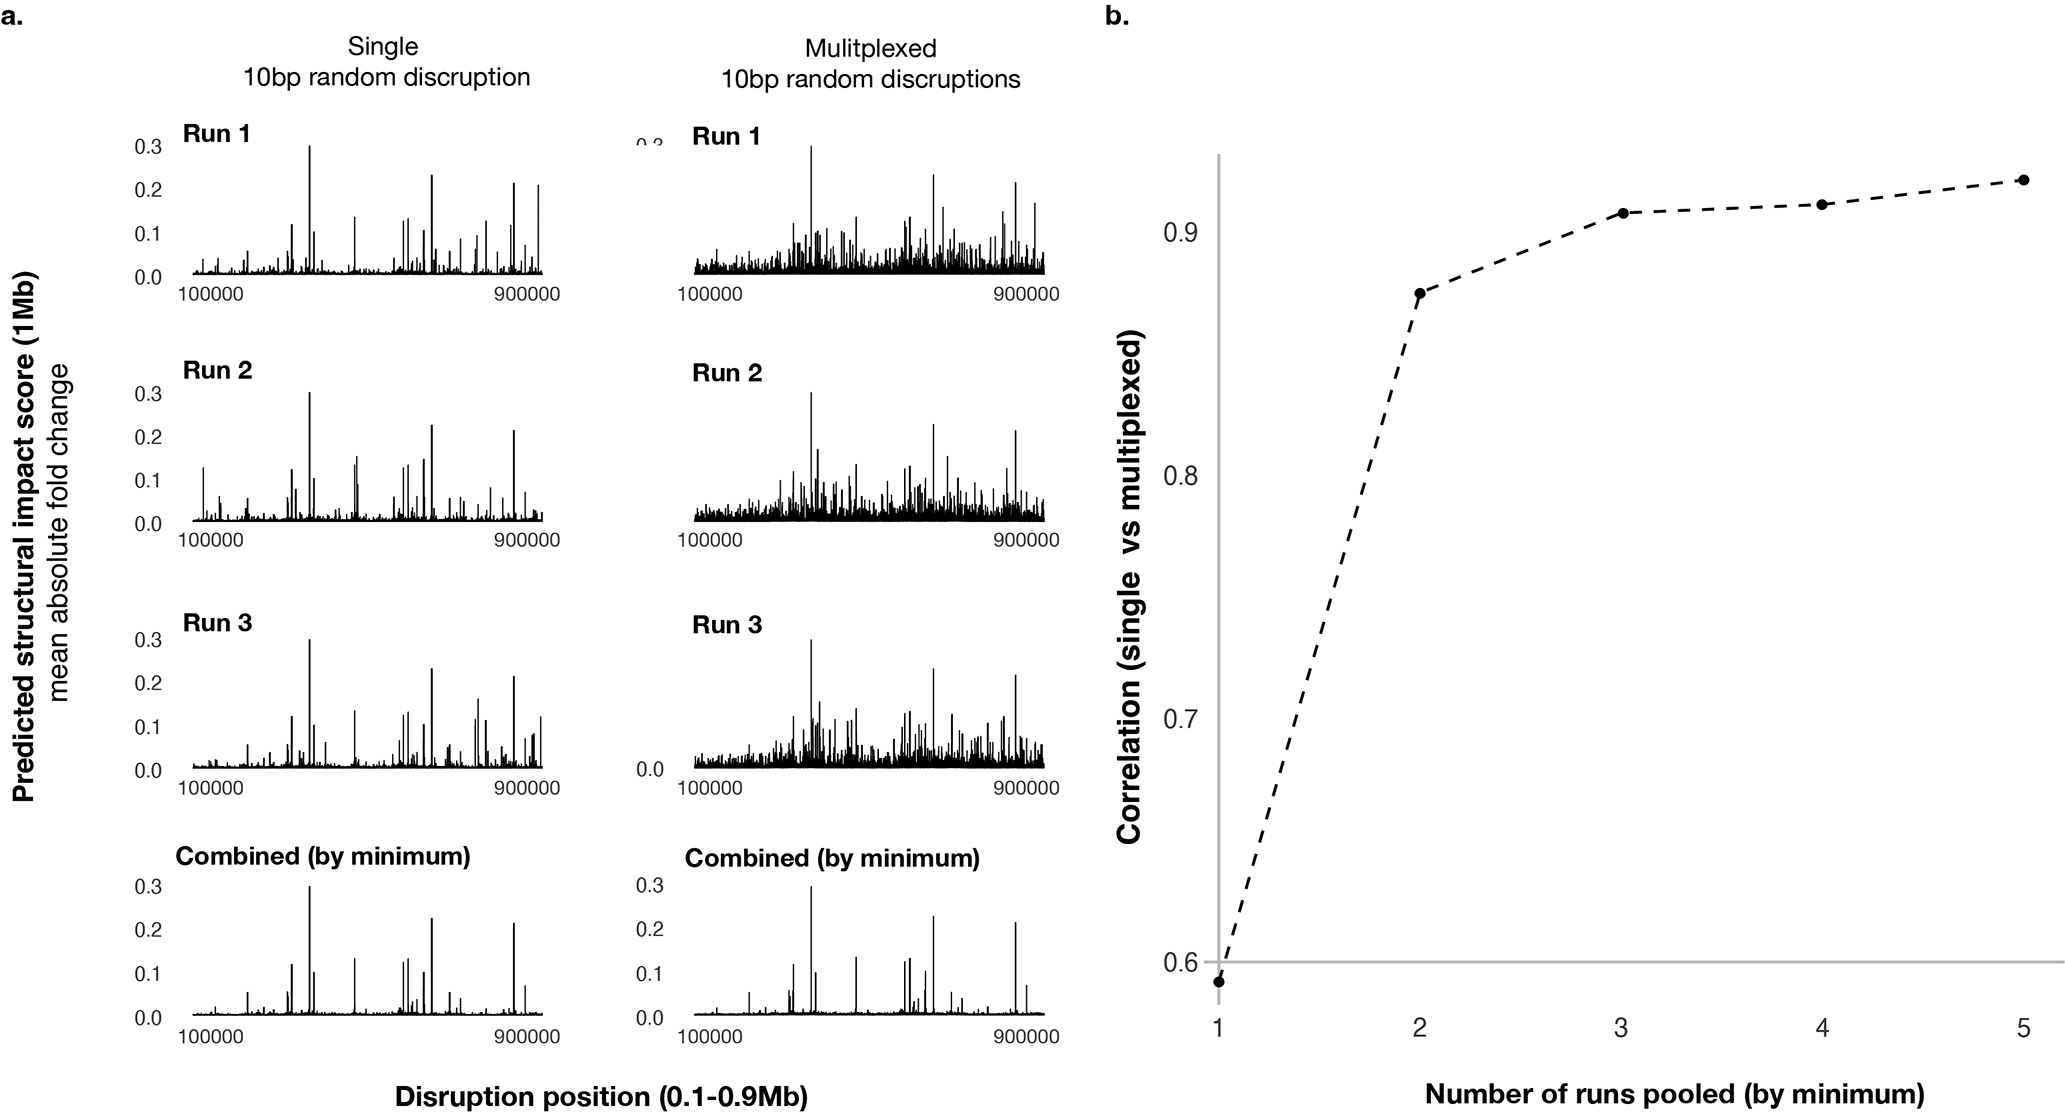
Extended Data Fig. 7. Multiplexed in silico mutagenesis screen results are highly correlated with single-mutation in silico mutagenesis screen results.

a). Predicted structural impact scores (1Mb) of single disruptions (left) and multiplexed disruptions are shown on the y-axis, with disruption positions on the x-axis. 10bp disruption sites screened cover the center 0.8Mb of the 1Mb region. The first three rows are three independent runs (for single disruption only the disrupted sequences are random across the runs, and for multiplexed disruption both the multiplex design of disruption sites and the disrupted sequences are random), and the last row shows the minimum of the three at each position. b). Relationship between the correlation of single and multiplexed disruption profiles (y-axis) and the number of runs combined (x-axis).
