
Fig. 3. Identification of cell-type-specific motifs that underlie predicted submegabase-scale genome interactions.
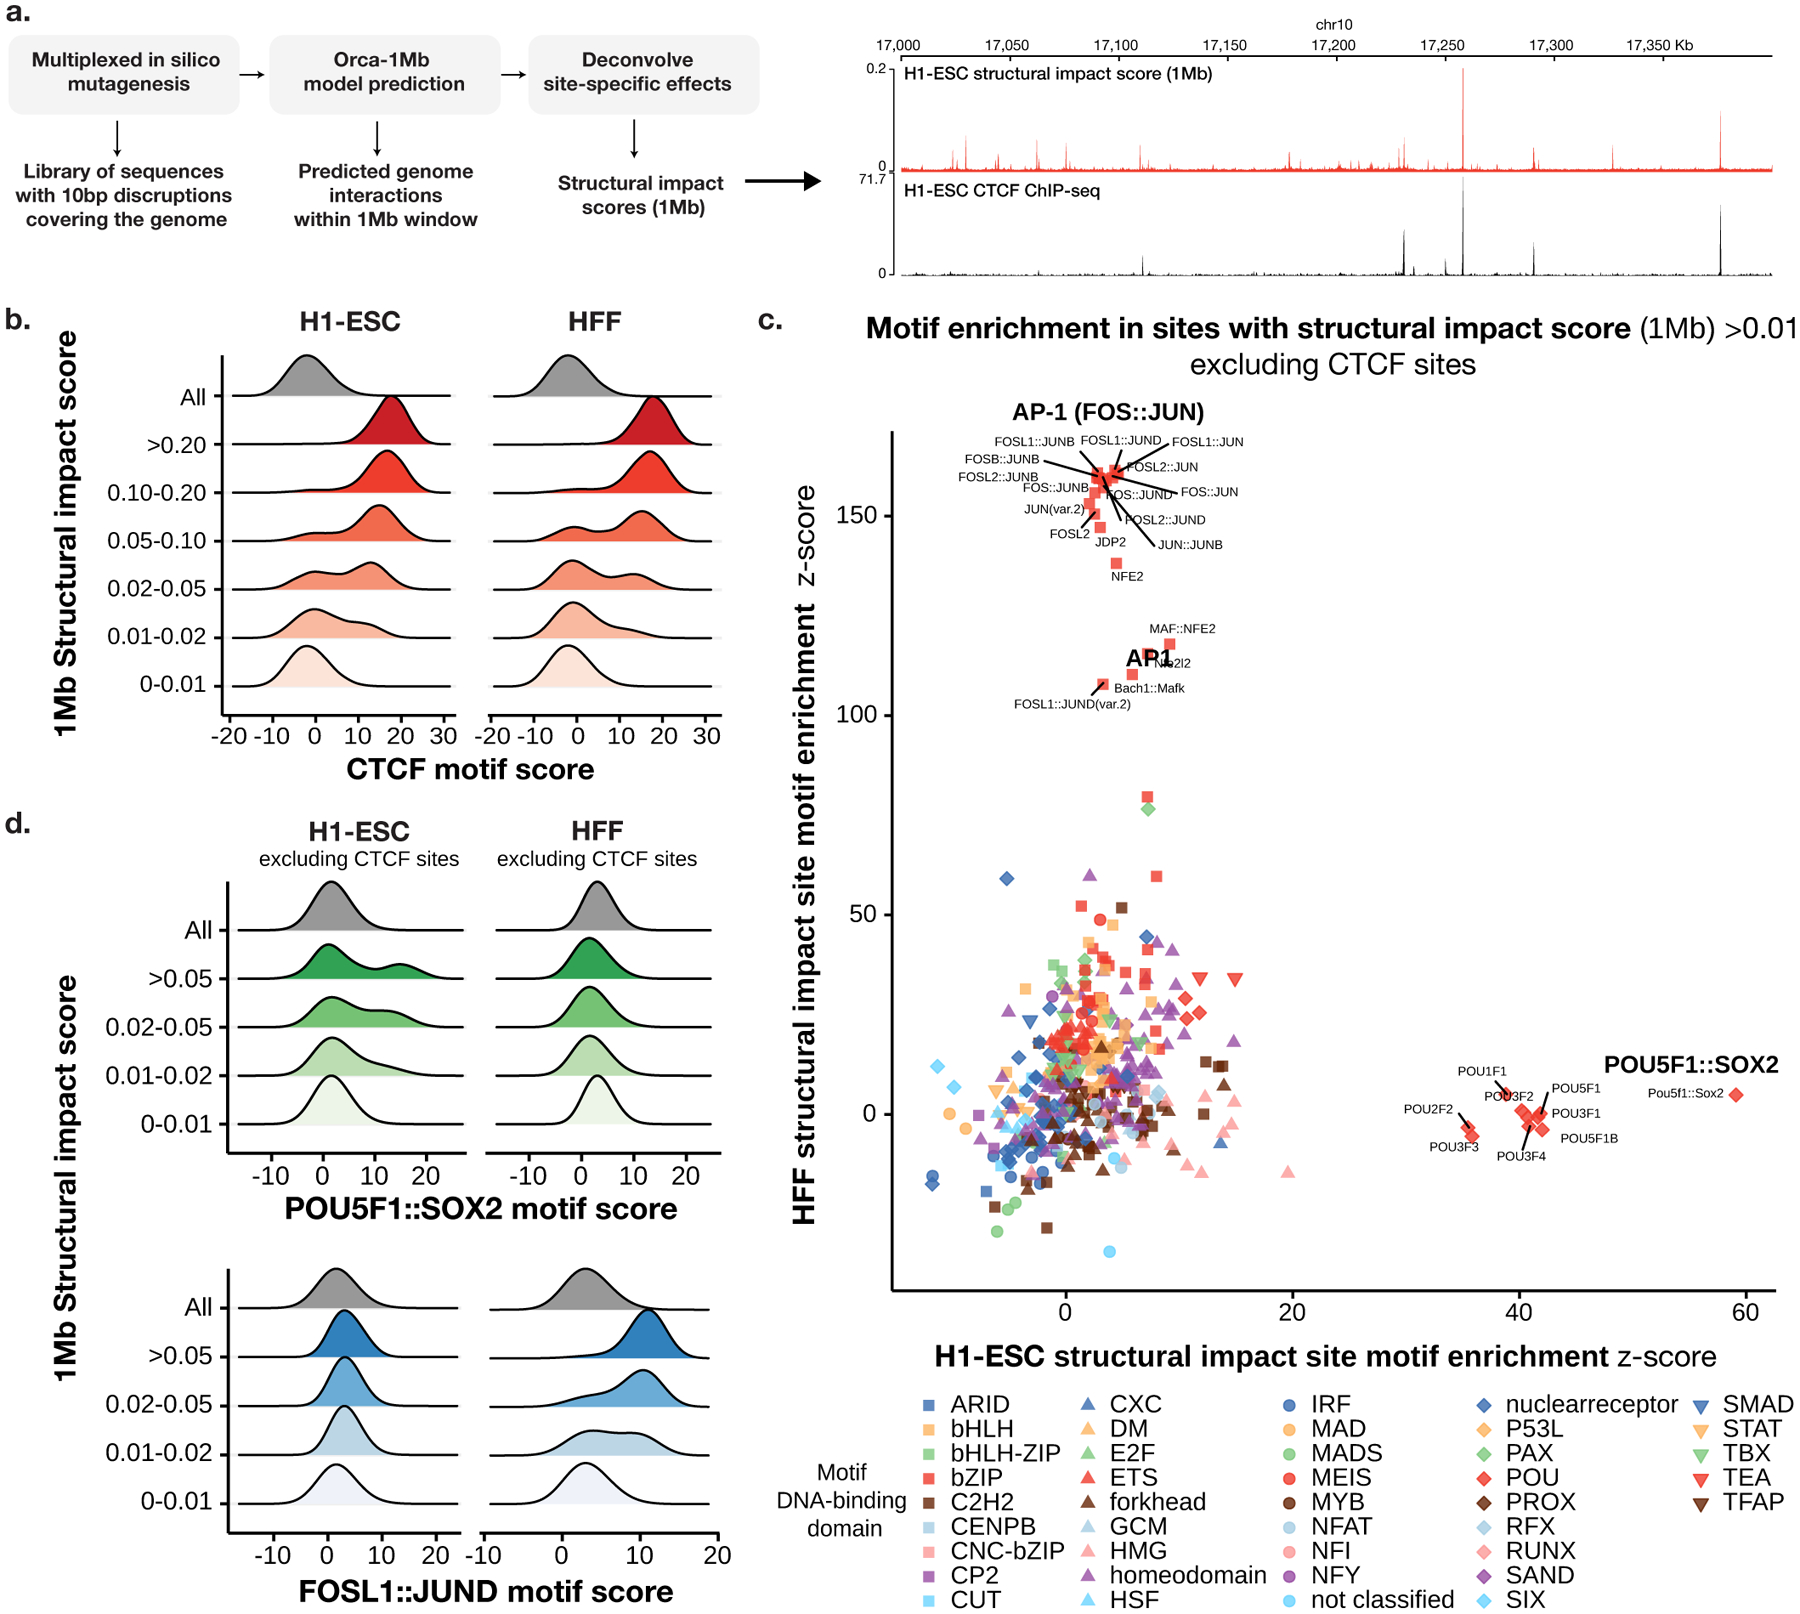
a). Overview of the virtual screen for motif-scale (10-bp) sequences with submegabase-scale structural impact. An example of the estimated 1-Mb structural impact score profile and CTCF ChIP-seq for a section of the genome is shown on the right. b). Distribution of CTCF motif scores (log odds) at 10-bp sequences (including 10-bp flanking sequence) stratified by 1-Mb structural impact score ranges in H1-ESC (left) and HFF (right) are shown. c). Comparison of H1-ESC and HFF structural impact motif enrichment at non-CTCF sites with structural impact scores >0.01. Significance z-scores by two-sided t-test for each motif in both cell types are shown in the scatter plot. Motifs are grouped by DNA-binding domain as in41. d) Distribution of the cell-type-specific POU5F1∷SOX2 and FOS∷JUN motif scores (log odds) at non-CTCF 10-bp sequences (including 10-bp flanking sequence) stratified by 1-Mb structural impact score ranges in H1-ESC (left) and HFF(right) are shown.