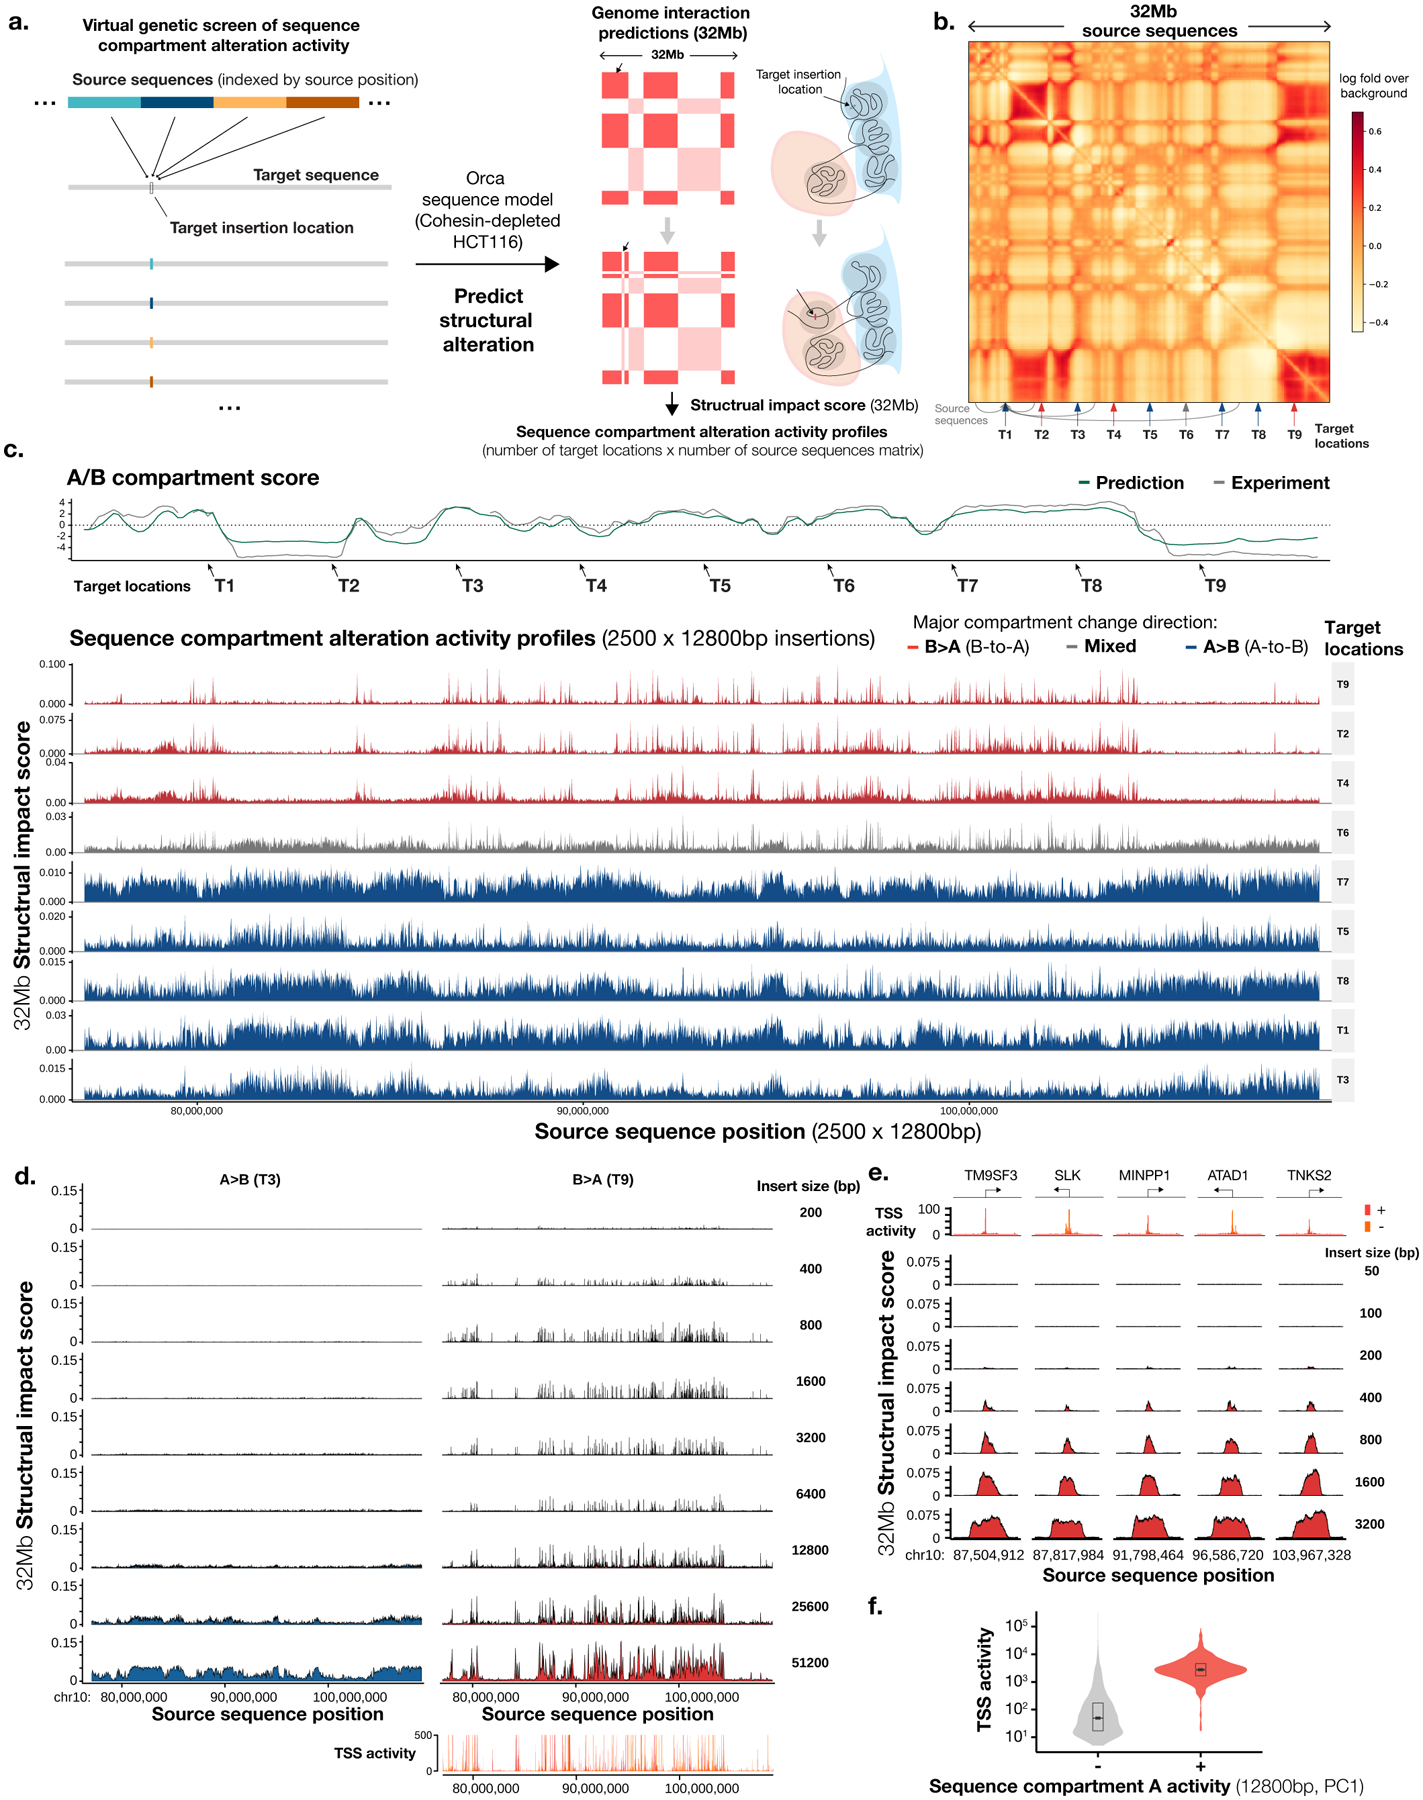
Fig. 4. Virtual screen profiling of sequence-dependencies of chromatin compartments identifies a prominent role of TSS sequences.

a). Design of the virtual genetic screen for sequence activities in altering chromatin compartment. Source sequences tiling a genomic region or whole chromosomes are inserted into one or multiple target locations by swapping out the original sequence. Genome interaction changes within a 32-Mb window are predicted for each source sequence. b). A virtual screen setup for a region of 32 Mb (chr10:77,072,000–109,072,000), with 9 target locations indicated by arrows and source sequences tiling the entire region. c). Sequence chromatin compartment activity profiles of all source sequences (12,800 bp each) from the 32-Mb region at nine target locations. Top panels show predicted (green) and observed (gray) chromatin A/B compartment scores as computed by the first principal component (PC) of the interaction matrix (high score indicates A compartment). Sequence activity profiles are grouped by the principal compartment change direction of targets: B>A (red), A>B (blue), and mixed (gray). The x-axis shows the locations of source sequences and the y-axis shows the 32-Mb structural impact scores, as measured by predicted average absolute log fold change in genome interactions with the insertion site within the 32-Mb window. d). Effects of insertion sequence sizes (200 bp to 51,200 bp) on chromatin compartment alteration activities, compared at two representative target locations T3 (A>B) and T9 (B<A). Compartment B>A activity is compared with TSS activities as represented by FANTOM CAGE signal (max count across samples). e). High-resolution analysis of sequence compartment A activities at loci with the strongest activities. The x-axis shows the center positions of the insertion sequence and the y-axis shows the 32-Mb structural impact scores. Insert sizes are also annotated. f). Comparison of TSS activities of sequences with and without compartment A activity (top 2% and bottom 98% 12,800-bp sequences, see Methods; total n = 27,281), indicated with ‘+’ sign and ‘−’ sign. The center values of the box plot represent the median; the bounds of boxes represent the 25th and the 75th percentiles; and the notch approximates a 95% confidence interval of the median.
